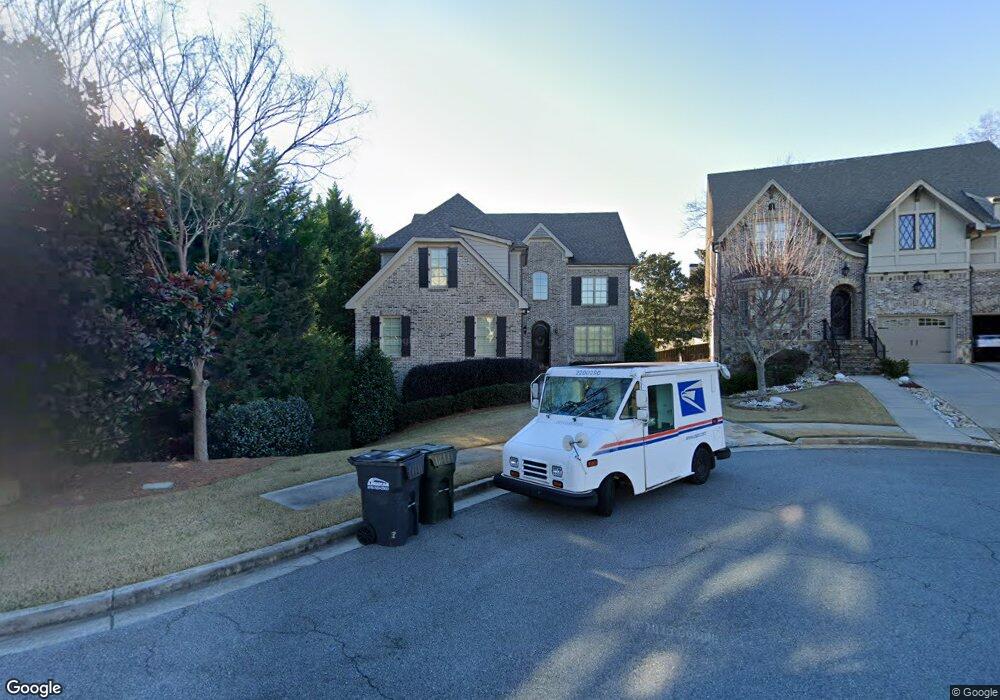
2135 Whitestone Ct SE Smyrna, GA 30080
Estimated Value: $944,204 - $1,280,000
5
Beds
6
Baths
4,582
Sq Ft
$235/Sq Ft
Est. Value
About This Home
This home is located at 2135 Whitestone Ct SE, Smyrna, GA 30080 and is currently estimated at $1,074,551, approximately $234 per square foot. 2135 Whitestone Ct SE is a home located in Cobb County with nearby schools including Nickajack Elementary School, Campbell Middle School, and Campbell High School.
Ownership History
Date
Name
Owned For
Owner Type
Purchase Details
Closed on
May 9, 2025
Sold by
Bonser Neil Christopher
Bought by
Neil Christopher Bonser Revocable Trust and Bonser
Current Estimated Value
Purchase Details
Closed on
Apr 2, 2015
Sold by
Vinings Designers Inc
Bought by
Bonser Amanda E and Bonser Neil C
Home Financials for this Owner
Home Financials are based on the most recent Mortgage that was taken out on this home.
Original Mortgage
$533,464
Interest Rate
3.84%
Mortgage Type
New Conventional
Purchase Details
Closed on
Jan 2, 2015
Sold by
Benchmark Planners And Consult
Bought by
Vinings Designers Inc
Create a Home Valuation Report for This Property
The Home Valuation Report is an in-depth analysis detailing your home's value as well as a comparison with similar homes in the area
Home Values in the Area
Average Home Value in this Area
Purchase History
| Date | Buyer | Sale Price | Title Company |
|---|---|---|---|
| Neil Christopher Bonser Revocable Trust | -- | None Listed On Document | |
| Neil Christopher Bonser Revocable Trust | -- | None Listed On Document | |
| Bonser Neil Christopher | -- | None Listed On Document | |
| Bonser Neil Christopher | -- | None Listed On Document | |
| Bonser Amanda E | $666,831 | -- | |
| Vinings Designers Inc | $132,000 | -- |
Source: Public Records
Mortgage History
| Date | Status | Borrower | Loan Amount |
|---|---|---|---|
| Previous Owner | Bonser Amanda E | $533,464 |
Source: Public Records
Tax History Compared to Growth
Tax History
| Year | Tax Paid | Tax Assessment Tax Assessment Total Assessment is a certain percentage of the fair market value that is determined by local assessors to be the total taxable value of land and additions on the property. | Land | Improvement |
|---|---|---|---|---|
| 2025 | $9,275 | $347,372 | $80,000 | $267,372 |
| 2024 | $9,281 | $347,372 | $80,000 | $267,372 |
| 2023 | $7,582 | $294,020 | $66,000 | $228,020 |
| 2022 | $8,181 | $294,020 | $66,000 | $228,020 |
| 2021 | $8,181 | $294,020 | $66,000 | $228,020 |
| 2020 | $8,181 | $294,020 | $66,000 | $228,020 |
| 2019 | $7,904 | $281,372 | $66,000 | $215,372 |
| 2018 | $7,892 | $280,804 | $60,000 | $220,804 |
| 2017 | $7,531 | $280,804 | $60,000 | $220,804 |
| 2016 | $6,604 | $238,604 | $60,000 | $178,604 |
| 2015 | $4,399 | $149,304 | $60,000 | $89,304 |
| 2014 | -- | $16,000 | $0 | $0 |
Source: Public Records
Map
Nearby Homes
- 2150 Whitestone Ct SE
- 1982 Cheyanne Dr SE
- 3721 Paces Park Cir SE
- 3703 Tynemoore Trace SE
- 1914 Tynemoore Ct SE
- 2027 Cooper Lake Dr SE
- 4089 Thorndale Ln SE Unit 13
- 3927 Pineview Dr SE
- 4059 Vinings Mill Trail SE
- 3412 Archerfield Way
- 2002 Ivy Ridge Rd SE
- 2282 McLean Chase SE
- 0 Church St Unit 10397761
- 0 Church St Unit 7473410
- 4097 Gilmore Rd SE
- 2128 Sonoma Dr SE
- 4051 Ridgehurst Dr SE
- 3522 Ivy Manor Rd SE
- 3916 Ridgewood Dr SE
- 2141 Whitestone Ct SE
- 2147 Whitestone Ct SE
- 2121 Whitestone Ct SE
- 2081 Westwood Cir SE
- 2153 Whitestone Ct SE Unit 4
- 2153 Whitestone Ct SE
- 3835 Redstone Ct SE
- 3835 Redstone Ct SE Unit 23
- 3845 Redstone Ct SE
- 2159 Whitestone Ct SE Unit 3
- 2159 Whitestone Ct SE
- 2115 Whitestone Ct SE
- 2071 Westwood Cir SE
- 2165 Whitestone Ct SE
- 2124 Whitestone Ct SE
- 2110 Cheyanne Dr SE
- 2120 Cheyanne Dr SE
- 2168 Whitestone Ct SE
- 3001 Westwood Cir SE
- 2130 Cheyanne Dr SE