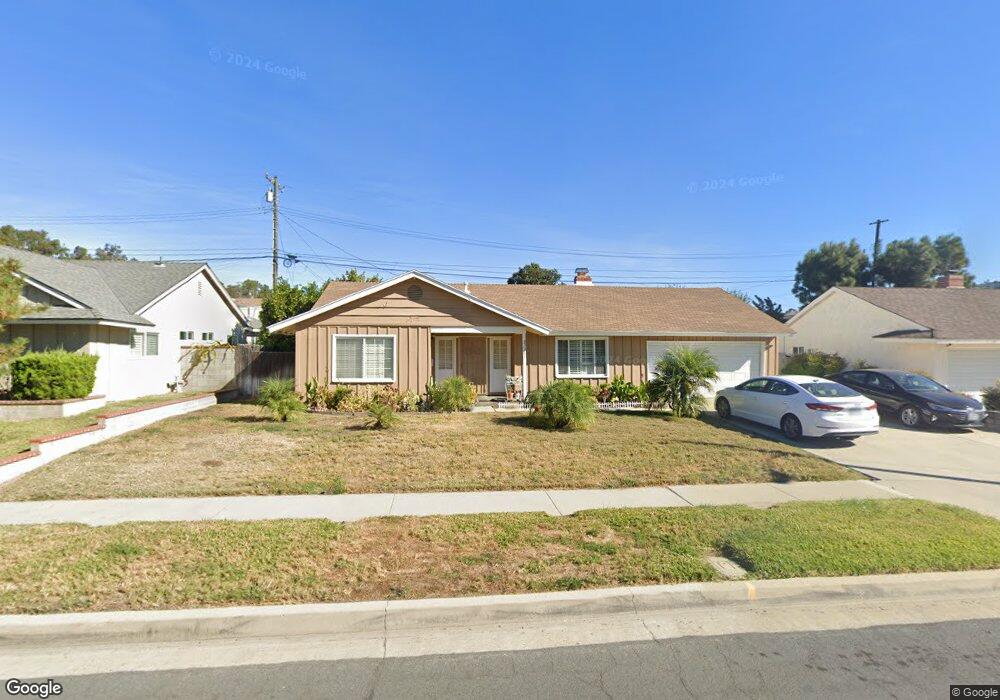
21361 Hidden Pines Dr Diamond Bar, CA 91765
Estimated Value: $906,000 - $1,325,000
3
Beds
2
Baths
2,100
Sq Ft
$491/Sq Ft
Est. Value
About This Home
This home is located at 21361 Hidden Pines Dr, Diamond Bar, CA 91765 and is currently estimated at $1,030,518, approximately $490 per square foot. 21361 Hidden Pines Dr is a home located in Los Angeles County with nearby schools including Castle Rock Elementary School, South Pointe Middle School, and Diamond Bar High School.
Ownership History
Date
Name
Owned For
Owner Type
Purchase Details
Closed on
Jan 28, 2005
Sold by
Truong Luong V and Chen Windy
Bought by
Choi Sung Ki
Current Estimated Value
Home Financials for this Owner
Home Financials are based on the most recent Mortgage that was taken out on this home.
Original Mortgage
$359,650
Outstanding Balance
$173,718
Interest Rate
5%
Mortgage Type
Purchase Money Mortgage
Estimated Equity
$856,800
Purchase Details
Closed on
Feb 13, 1996
Sold by
Chen Windy and Truong Luong V
Bought by
Truong Luong and Chen Windy
Home Financials for this Owner
Home Financials are based on the most recent Mortgage that was taken out on this home.
Original Mortgage
$140,000
Interest Rate
7.1%
Purchase Details
Closed on
Mar 22, 1994
Sold by
White Robert L
Bought by
Chen Windy
Home Financials for this Owner
Home Financials are based on the most recent Mortgage that was taken out on this home.
Original Mortgage
$154,800
Interest Rate
8.52%
Create a Home Valuation Report for This Property
The Home Valuation Report is an in-depth analysis detailing your home's value as well as a comparison with similar homes in the area
Home Values in the Area
Average Home Value in this Area
Purchase History
| Date | Buyer | Sale Price | Title Company |
|---|---|---|---|
| Choi Sung Ki | $469,000 | Fidelity National Title Co | |
| Truong Luong | -- | Gateway Title Company | |
| Chen Windy | $172,000 | Old Republic Title Company |
Source: Public Records
Mortgage History
| Date | Status | Borrower | Loan Amount |
|---|---|---|---|
| Open | Choi Sung Ki | $359,650 | |
| Previous Owner | Truong Luong | $140,000 | |
| Previous Owner | Chen Windy | $154,800 | |
| Closed | Choi Sung Ki | $62,400 |
Source: Public Records
Tax History Compared to Growth
Tax History
| Year | Tax Paid | Tax Assessment Tax Assessment Total Assessment is a certain percentage of the fair market value that is determined by local assessors to be the total taxable value of land and additions on the property. | Land | Improvement |
|---|---|---|---|---|
| 2025 | $7,964 | $653,727 | $522,989 | $130,738 |
| 2024 | $7,964 | $640,910 | $512,735 | $128,175 |
| 2023 | $7,773 | $628,344 | $502,682 | $125,662 |
| 2022 | $7,610 | $616,025 | $492,826 | $123,199 |
| 2021 | $7,471 | $603,947 | $483,163 | $120,784 |
| 2019 | $7,234 | $586,035 | $468,833 | $117,202 |
| 2018 | $6,924 | $574,545 | $459,641 | $114,904 |
| 2016 | $6,419 | $552,237 | $441,794 | $110,443 |
| 2015 | $6,312 | $531,000 | $425,000 | $106,000 |
| 2014 | $5,939 | $487,400 | $390,400 | $97,000 |
Source: Public Records
Map
Nearby Homes
- 2710 Castle Rock Rd
- 21223 Fountain Springs Rd
- 2463 Harmony Hill Dr
- 2831 Steeplechase Ln
- 2611 Steeplechase Ln
- 2621 Steeplechase Ln
- 21128 Trigger Ln
- 2968 Crooked Creek Dr
- 2887 Shadow Canyon Rd
- 2820 Shadow Canyon Rd
- 2990 Malaga Cir Unit C
- 2905 Yucatan Place Unit A
- 21062 Quail Run Dr
- 2945 Steeplechase Ln
- 2562 Steeplechase Ln
- 3005 La Paz Ln Unit C
- 3145 Steeplechase Ln
- 2118 Tierra Loma Dr
- 2677 Wagon Train Ln
- 22189 Rim Fire Ln
- 21355 Hidden Pines Dr
- 21369 Hidden Pines Dr
- 21334 Fountain Springs Rd
- 21344 Fountain Springs Rd
- 21326 Fountain Springs Rd
- 21347 Hidden Pines Dr
- 21377 Hidden Pines Dr
- 21360 Hidden Pines Dr
- 21354 Hidden Pines Dr
- 21352 Fountain Springs Rd
- 21368 Hidden Pines Dr
- 21320 Fountain Springs Rd
- 21346 Hidden Pines Dr
- 21376 Hidden Pines Dr
- 21339 Hidden Pines Dr
- 21325 Hipass Dr
- 21312 Fountain Springs Rd
- 21317 Hipass Dr
- 21335 Fountain Springs Rd
- 21341 Fountain Springs Rd