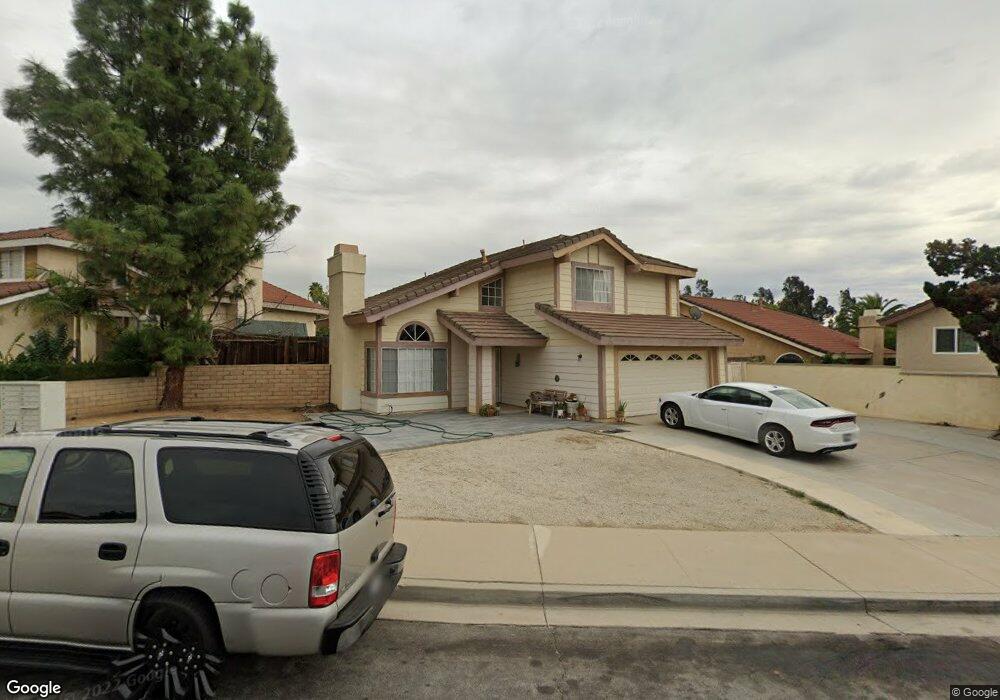
21369 Douglasis Ct Moreno Valley, CA 92557
North Moreno Valley NeighborhoodEstimated Value: $514,007 - $569,000
3
Beds
3
Baths
1,420
Sq Ft
$380/Sq Ft
Est. Value
About This Home
This home is located at 21369 Douglasis Ct, Moreno Valley, CA 92557 and is currently estimated at $540,002, approximately $380 per square foot. 21369 Douglasis Ct is a home located in Riverside County with nearby schools including Seneca Elementary School, Vista Heights Middle School, and Canyon Springs High School.
Ownership History
Date
Name
Owned For
Owner Type
Purchase Details
Closed on
Nov 3, 2011
Sold by
Naranjo Javier Geronimo and Geronimo Hilda
Bought by
Rodriguez Dolores M
Current Estimated Value
Purchase Details
Closed on
Mar 14, 2011
Sold by
Garcia Dolores M and Jeronimo Cynthia
Bought by
Naranio Javier Geronimo and Geronimo Hilda
Purchase Details
Closed on
Apr 21, 1998
Sold by
Va
Bought by
Jeronimo Cynthia and Flores Vicente
Home Financials for this Owner
Home Financials are based on the most recent Mortgage that was taken out on this home.
Original Mortgage
$104,258
Interest Rate
7.11%
Mortgage Type
FHA
Purchase Details
Closed on
Nov 17, 1997
Sold by
Midfirst Bank
Bought by
Hud
Purchase Details
Closed on
Jul 8, 1997
Sold by
Moore Ralph and Moore Beverly
Bought by
Midfirst Bank and Midfirst Bank Ssb
Purchase Details
Closed on
Apr 18, 1997
Sold by
Moore Beverly
Bought by
Pacific Coast Properties Inc
Create a Home Valuation Report for This Property
The Home Valuation Report is an in-depth analysis detailing your home's value as well as a comparison with similar homes in the area
Home Values in the Area
Average Home Value in this Area
Purchase History
| Date | Buyer | Sale Price | Title Company |
|---|---|---|---|
| Rodriguez Dolores M | -- | None Available | |
| Naranio Javier Geronimo | -- | None Available | |
| Jeronimo Cynthia | $105,500 | First Southwestern Title Co | |
| Hud | -- | United Title Company | |
| Midfirst Bank | $180,124 | United Title Company | |
| Pacific Coast Properties Inc | -- | -- | |
| Pacific Coast Properties Inc | -- | -- |
Source: Public Records
Mortgage History
| Date | Status | Borrower | Loan Amount |
|---|---|---|---|
| Previous Owner | Jeronimo Cynthia | $104,258 |
Source: Public Records
Tax History Compared to Growth
Tax History
| Year | Tax Paid | Tax Assessment Tax Assessment Total Assessment is a certain percentage of the fair market value that is determined by local assessors to be the total taxable value of land and additions on the property. | Land | Improvement |
|---|---|---|---|---|
| 2025 | $2,478 | $211,379 | $76,864 | $134,515 |
| 2023 | $2,478 | $203,173 | $73,880 | $129,293 |
| 2022 | $2,386 | $199,190 | $72,432 | $126,758 |
| 2021 | $2,343 | $195,285 | $71,012 | $124,273 |
| 2020 | $2,318 | $193,283 | $70,284 | $122,999 |
| 2019 | $2,281 | $189,494 | $68,906 | $120,588 |
| 2018 | $2,237 | $185,779 | $67,555 | $118,224 |
| 2017 | $2,190 | $182,137 | $66,231 | $115,906 |
| 2016 | $2,168 | $178,567 | $64,933 | $113,634 |
| 2015 | $2,138 | $175,886 | $63,958 | $111,928 |
| 2014 | $1,994 | $172,443 | $62,706 | $109,737 |
Source: Public Records
Map
Nearby Homes
- 21320 Box Springs Rd
- 21312 Pala Foxia Place
- 21480 Marston Ct
- 21665 Box Springs Rd
- 21484 Dickinson Rd
- 21200 Lands End
- 21695 Del Amo St
- 21329 Tennyson Rd
- 22086 Naples Dr
- 20517 Claremont Ave
- 1447 Lochaber Ct
- 20468 College Blvd
- 5550 Allendale Dr
- 0 Harvard Way
- 1443 Sutherland Dr
- 1434 Haddington Dr
- 12313 Timlico Ct
- 20409 Harvard Way
- 0 Pettegrew Rd Unit IV24204869
- 21737 Eucalyptus Ave
- 21379 Douglasis Ct
- 21380 Blossom Hill Ln
- 21368 Blossom Hill Ln
- 21392 Blossom Hill Ln
- 21389 Douglasis Ct
- 21404 Blossom Hill Ln
- 21370 Douglasis Ct
- 21360 Douglasis Ct
- 21399 Douglasis Ct
- 21380 Douglasis Ct
- 21416 Blossom Hill Ln
- 11980 Lewisia Ave
- 21390 Douglasis Ct
- 21350 Douglasis Ct
- 21425 Salix Ave
- 21409 Douglasis Ct
- 21400 Douglasis Ct
- 21426 Blossom Hill Ln
- 11968 Lewisia Ave
- 21379 Blossom Hill Ln