Estimated Value: $487,000 - $616,815
5
Beds
4
Baths
2,618
Sq Ft
$212/Sq Ft
Est. Value
About This Home
This home is located at 2137 336th St, Osage, IA 50461 and is currently estimated at $554,704, approximately $211 per square foot. 2137 336th St is a home located in Mitchell County with nearby schools including Lincoln Elementary School, Osage Middle School, and Osage High School.
Ownership History
Date
Name
Owned For
Owner Type
Purchase Details
Closed on
Jan 10, 2014
Sold by
Dmr Investments Llc
Bought by
Carpenter Troy R and Carpenter Lacey L
Current Estimated Value
Home Financials for this Owner
Home Financials are based on the most recent Mortgage that was taken out on this home.
Original Mortgage
$217,000
Interest Rate
4.14%
Mortgage Type
New Conventional
Purchase Details
Closed on
Dec 30, 2013
Sold by
Carpenter Troy R and Carpenter Lacey L
Bought by
Swann Nicole
Home Financials for this Owner
Home Financials are based on the most recent Mortgage that was taken out on this home.
Original Mortgage
$217,000
Interest Rate
4.14%
Mortgage Type
New Conventional
Create a Home Valuation Report for This Property
The Home Valuation Report is an in-depth analysis detailing your home's value as well as a comparison with similar homes in the area
Home Values in the Area
Average Home Value in this Area
Purchase History
| Date | Buyer | Sale Price | Title Company |
|---|---|---|---|
| Carpenter Troy R | -- | None Available | |
| Swann Nicole | $260,000 | None Available |
Source: Public Records
Mortgage History
| Date | Status | Borrower | Loan Amount |
|---|---|---|---|
| Previous Owner | Swann Nicole | $217,000 |
Source: Public Records
Tax History Compared to Growth
Tax History
| Year | Tax Paid | Tax Assessment Tax Assessment Total Assessment is a certain percentage of the fair market value that is determined by local assessors to be the total taxable value of land and additions on the property. | Land | Improvement |
|---|---|---|---|---|
| 2025 | $6,040 | $572,540 | $51,690 | $520,850 |
| 2024 | $6,040 | $516,750 | $51,690 | $465,060 |
| 2023 | $5,764 | $516,750 | $51,690 | $465,060 |
| 2022 | $5,374 | $408,180 | $51,690 | $356,490 |
| 2021 | $5,374 | $408,180 | $51,690 | $356,490 |
| 2020 | $4,062 | $330,150 | $47,090 | $283,060 |
Source: Public Records
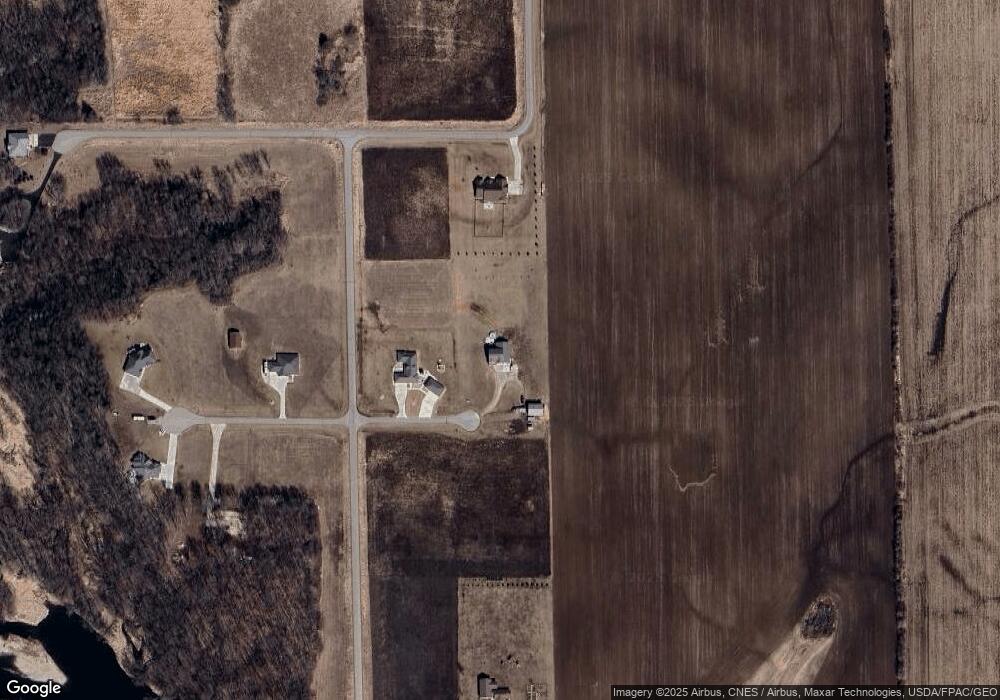
Map
Nearby Homes
- 2135 336th St
- 2119 336th St
- 2131 336th St
- 2137 334th St
- 2122 336th St
- 2121 336th St
- 3395 Mahogany Ave
- 3324 Mahogany Ave
- 3319 Mahogany Ave
- 0 Mahogany Ave
- 2138 338th St
- 1505 Chase St
- 1415 Chase St
- 1425 Chase St
- 1431 Chase St
- 1509 Chase St
- 3397 Mahogany Ave
- 2154 340th St
- 3337 Mahogany Ave
- 2112 338th St