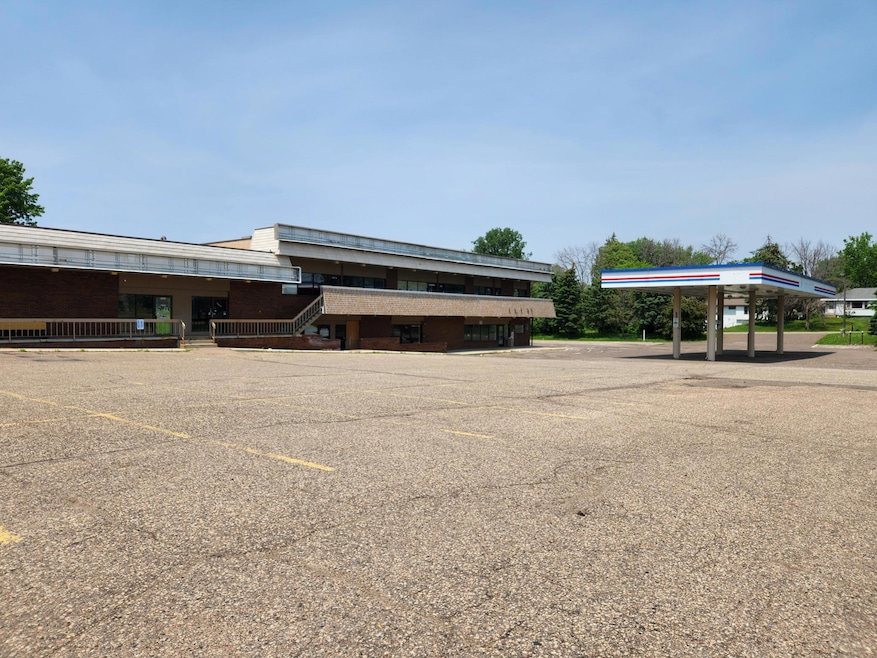
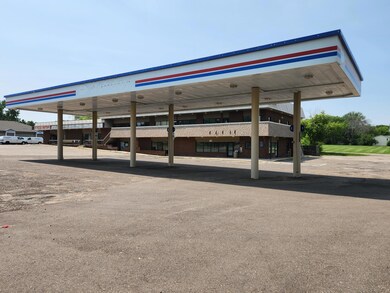
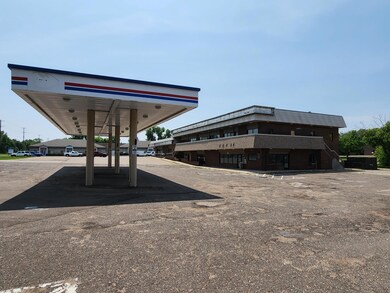
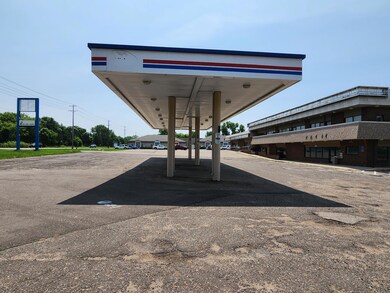
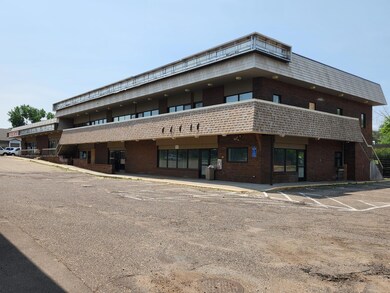
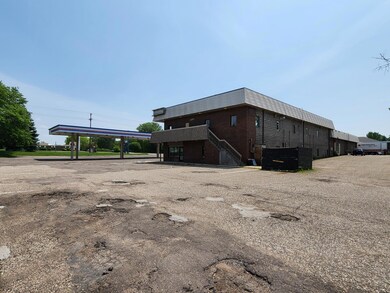
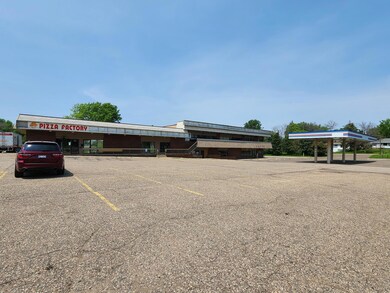
2137 Division St N North Saint Paul, MN 55109
Estimated payment $6,265/month
About This Lot
This well located, 1st ring suburban site provides a great opportunity for multiple future uses.
Property Details
Property Type
- Land
Lot Details
- Lot Dimensions are 272 x 292 x 272 x 292
- Zoning described as Business/Commercial,Residential-Multi-Family,Other
Community Details
- No Home Owners Association
- Section 13 Town 29 Range 22 Subdivision
Listing and Financial Details
- Assessor Parcel Number 132922110081
Map
Home Values in the Area
Average Home Value in this Area
Tax History
| Year | Tax Paid | Tax Assessment Tax Assessment Total Assessment is a certain percentage of the fair market value that is determined by local assessors to be the total taxable value of land and additions on the property. | Land | Improvement |
|---|---|---|---|---|
| 2025 | $34,966 | $1,015,200 | $633,300 | $381,900 |
| 2023 | $34,966 | $1,084,900 | $633,300 | $451,600 |
| 2022 | $34,568 | $907,400 | $633,300 | $274,100 |
| 2021 | $36,052 | $974,100 | $633,300 | $340,800 |
| 2020 | $42,266 | $1,013,000 | $633,300 | $379,700 |
| 2018 | $41,672 | $1,122,900 | $633,300 | $489,600 |
| 2017 | $38,046 | $1,055,100 | $633,300 | $421,800 |
| 2016 | $34,678 | $0 | $0 | $0 |
| 2015 | $34,822 | $875,500 | $633,300 | $242,200 |
| 2014 | $36,844 | $0 | $0 | $0 |
Property History
| Date | Event | Price | List to Sale | Price per Sq Ft |
|---|---|---|---|---|
| 10/30/2025 10/30/25 | Pending | -- | -- | -- |
| 07/23/2025 07/23/25 | Off Market | $1,000,000 | -- | -- |
| 07/07/2025 07/07/25 | For Sale | $1,000,000 | -- | -- |
Source: NorthstarMLS
MLS Number: 6744180
APN: 13-29-22-11-0081
Disclaimer: Certain information contained herein is derived from information provided by parties other than Homes.com. All information provided is deemed reliable, but is not guaranteed to be accurate and should be independently verified.
![]() Based on information submitted to the MLS GRID. All data is obtained from various sources and may not have been verified by broker or MLS GRID. Supplied Open House Information is subject to change without notice. All information should be independently reviewed and verified for accuracy. Properties may or may not be listed by the office/agent presenting the information. Some IDX listings have been excluded from this website.
Based on information submitted to the MLS GRID. All data is obtained from various sources and may not have been verified by broker or MLS GRID. Supplied Open House Information is subject to change without notice. All information should be independently reviewed and verified for accuracy. Properties may or may not be listed by the office/agent presenting the information. Some IDX listings have been excluded from this website.
The Digital Millennium Copyright Act of 1998, 17 U.S.C. § 512 (the “DMCA”) provides recourse for copyright owners who believe that material appearing on the Internet infringes their rights under U.S. copyright law. If you believe in good faith that any content or material made available in connection with our website or services infringes your copyright, you (or your agent) may send us a notice requesting that the content or material be removed, or access to it blocked.
Notices must be sent in writing by email to DMCAnotice@MLSGrid.com.
The DMCA requires that your notice of alleged copyright infringement include the following information:
(1) description of the copyrighted work that is the subject of claimed infringement;
(2) description of the alleged infringing content and information sufficient to permit us to locate the content;
(3) contact information for you, including your address, telephone number and email address;
(4) a statement by you that you have a good faith belief that the content in the manner complained of is not authorized by the copyright owner, or its agent, or by the operation of any law;
(5) a statement by you, signed under penalty of perjury, that the information in the notification is accurate and that you have the authority to enforce the copyrights that are claimed to be infringed; and
(6) a physical or electronic signature of the copyright owner or a person authorized to act on the copyright owner’s behalf. Failure to include all of the above information may result in the delay of the processing of your complaint.
- 7942 42nd St N
- 6316 43rd St N
- 6298 Upper 46th St N
- 2535 3rd Ave E
- 3662 Gershwin Ln N
- 2597 Burke Ave E
- 3691 Gershwin Ln N
- 3708 Gershwin Ln N
- 3945 Gershwin Ave N
- 3742 Gershwin Ave N
- 3740 Gershwin Ave N
- 2547 14th Ave E
- 6241 50th St N
- 2603 17th Ave E
- 2231 N Penn Place Unit 120
- 2231 N Penn Place Unit 114
- 2231 N Penn Place Unit 201
- 2231 N Penn Place Unit 209
- 2507 Belmont Ln E
- 3590 Genevieve Ave N
