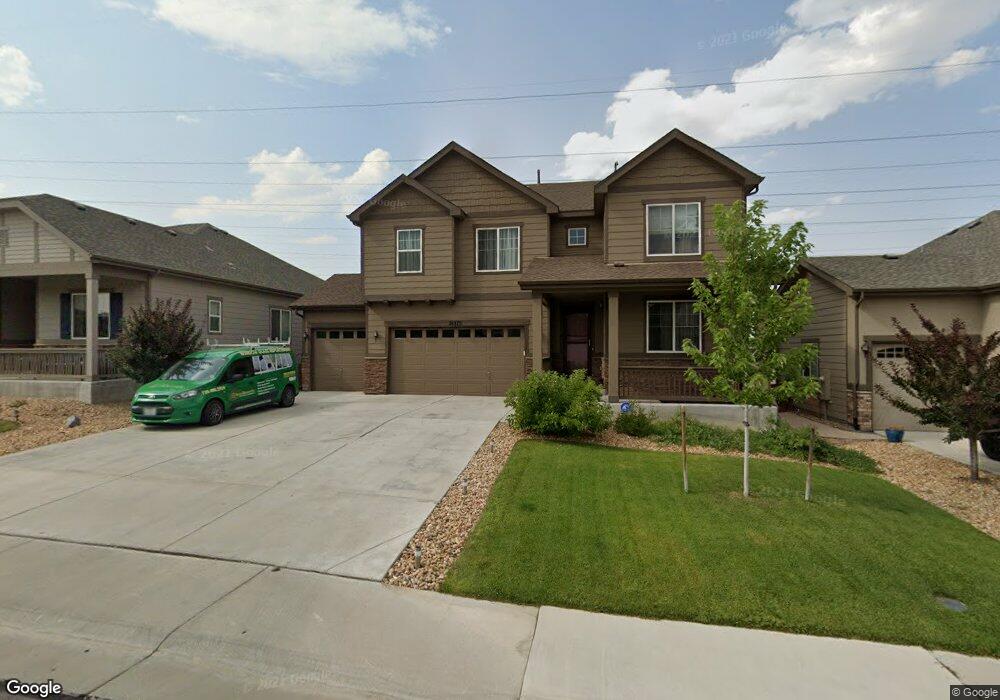
21375 E Union Place Aurora, CO 80015
Copperleaf NeighborhoodEstimated Value: $671,224 - $736,000
4
Beds
3
Baths
4,229
Sq Ft
$166/Sq Ft
Est. Value
About This Home
This home is located at 21375 E Union Place, Aurora, CO 80015 and is currently estimated at $702,056, approximately $166 per square foot. 21375 E Union Place is a home located in Arapahoe County with nearby schools including Aspen Crossing Elementary School, Sky Vista Middle School, and Eaglecrest High School.
Ownership History
Date
Name
Owned For
Owner Type
Purchase Details
Closed on
Apr 19, 2021
Sold by
Saglyan Grant G and Sigilyen Eduard
Bought by
Takmazyan Kristina
Current Estimated Value
Home Financials for this Owner
Home Financials are based on the most recent Mortgage that was taken out on this home.
Original Mortgage
$386,000
Outstanding Balance
$346,237
Interest Rate
3%
Mortgage Type
New Conventional
Estimated Equity
$355,819
Purchase Details
Closed on
Nov 19, 2019
Sold by
Sagilyan Grant G and Sagilyan Eduard
Bought by
Sagilyan Grant G and Sagilyan Eduard
Purchase Details
Closed on
Jul 20, 2016
Sold by
Richmond American Homes Of Colorado Inc
Bought by
Sagilyan Grant G and Sagilyan Eduard
Home Financials for this Owner
Home Financials are based on the most recent Mortgage that was taken out on this home.
Original Mortgage
$395,592
Interest Rate
3.6%
Mortgage Type
New Conventional
Create a Home Valuation Report for This Property
The Home Valuation Report is an in-depth analysis detailing your home's value as well as a comparison with similar homes in the area
Home Values in the Area
Average Home Value in this Area
Purchase History
| Date | Buyer | Sale Price | Title Company |
|---|---|---|---|
| Takmazyan Kristina | -- | Capital Title | |
| Sagilyan Grant G | -- | None Available | |
| Sagilyan Grant G | $439,500 | None Available |
Source: Public Records
Mortgage History
| Date | Status | Borrower | Loan Amount |
|---|---|---|---|
| Open | Takmazyan Kristina | $386,000 | |
| Previous Owner | Sagilyan Grant G | $395,592 |
Source: Public Records
Tax History
| Year | Tax Paid | Tax Assessment Tax Assessment Total Assessment is a certain percentage of the fair market value that is determined by local assessors to be the total taxable value of land and additions on the property. | Land | Improvement |
|---|---|---|---|---|
| 2025 | $6,018 | $42,494 | -- | -- |
| 2024 | $5,742 | $45,500 | -- | -- |
| 2023 | $5,742 | $45,500 | $0 | $0 |
| 2022 | $4,704 | $36,043 | $0 | $0 |
| 2021 | $4,720 | $36,043 | $0 | $0 |
| 2020 | $4,586 | $0 | $0 | $0 |
| 2019 | $5,387 | $35,793 | $0 | $0 |
| 2018 | $5,117 | $31,558 | $0 | $0 |
| 2017 | $5,089 | $31,558 | $0 | $0 |
| 2016 | $2,069 | $12,139 | $0 | $0 |
| 2015 | $760 | $4,782 | $0 | $0 |
| 2014 | $522 | $2,970 | $0 | $0 |
| 2013 | -- | $1,960 | $0 | $0 |
Source: Public Records
Map
Nearby Homes
- 4683 S Nepal Way
- 4655 S Odessa St
- 4632 S Malaya Ct
- 4630 S Odessa St
- 21339 E Tufts Ave
- 20541 E Union Ave
- 4778 S Picadilly Ct
- 4468 S Malaya Ct
- 20431 E Union Cir
- 4366 S Nepal St
- 4337 S Nepal Ct
- 4346 S Netherland St
- 20970 E Quincy Dr
- 20528 E Grand Ln
- 4825 S Riviera Way
- 4849 S Riviera Way
- 21876 E Radcliff Cir
- 21803 E Quincy Place
- 21832 E Quincy Cir
- 22093 E Stanford Dr
- 21395 E Union Place
- 21355 E Union Place
- 21335 E Union Place
- 21407 E Union Place
- 21396 E Union Place
- 21417 E Union Place
- 4695 S Odessa St
- 4692 S Malaya Ct
- 4747 S Odessa St
- 4689 S Odessa St
- 21418 E Union Place
- 4686 S Malaya Ct
- 4736 S Netherland St
- 4726 S Netherland St
- 4722 S Netherland St
- 4757 S Odessa St
- 4685 S Odessa St
- 21438 E Union Place
- 4746 S Netherland St
- 4716 S Netherland St
Your Personal Tour Guide
Ask me questions while you tour the home.