Estimated Value: $622,000 - $690,000
5
Beds
2
Baths
1,066
Sq Ft
$610/Sq Ft
Est. Value
About This Home
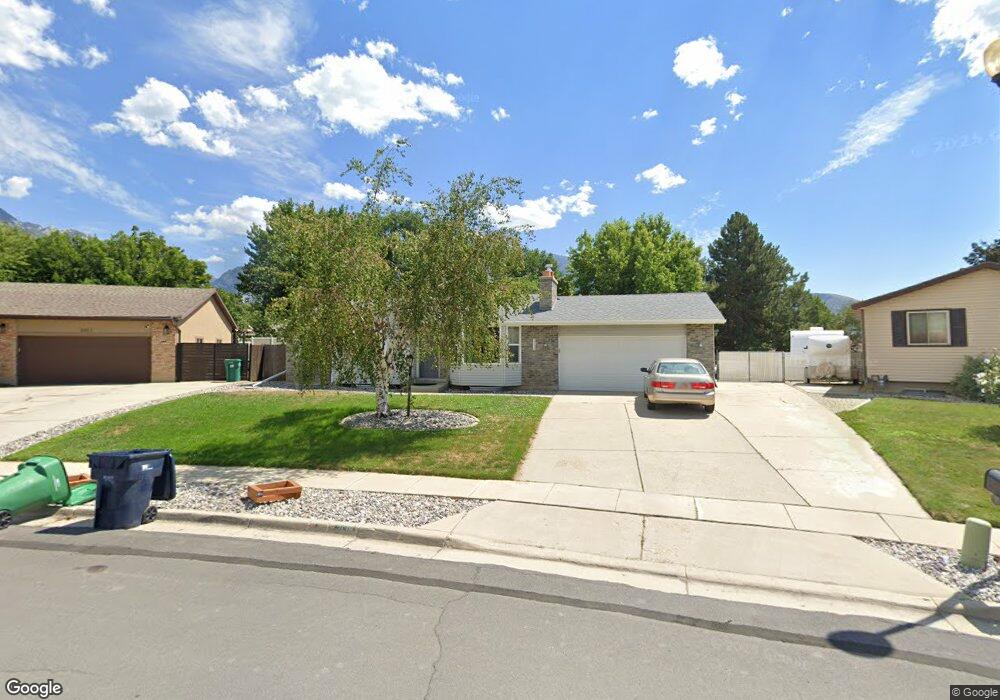
This home is located at 2138 Buckingham Way, Sandy, UT 84093 and is currently estimated at $650,386, approximately $610 per square foot. 2138 Buckingham Way is a home located in Salt Lake County with nearby schools including Quail Hollow Elementary School, Albion Middle School, and Brighton High School.
Ownership History
Date
Name
Owned For
Owner Type
Purchase Details
Closed on
Jun 6, 2014
Sold by
Millenbach Karen J and Millenbach Karen
Bought by
Jameson Scott and Jameson Elizabeth
Current Estimated Value
Home Financials for this Owner
Home Financials are based on the most recent Mortgage that was taken out on this home.
Original Mortgage
$179,120
Outstanding Balance
$136,601
Interest Rate
4.27%
Mortgage Type
New Conventional
Estimated Equity
$513,785
Purchase Details
Closed on
Jun 4, 1998
Sold by
Herbert Matthew P and Herbert Kathi G
Bought by
Millenbach Karen J and Millenbach Brian J
Home Financials for this Owner
Home Financials are based on the most recent Mortgage that was taken out on this home.
Original Mortgage
$124,000
Interest Rate
7.1%
Create a Home Valuation Report for This Property
The Home Valuation Report is an in-depth analysis detailing your home's value as well as a comparison with similar homes in the area
Home Values in the Area
Average Home Value in this Area
Purchase History
| Date | Buyer | Sale Price | Title Company |
|---|---|---|---|
| Jameson Scott | -- | Meridian Title | |
| Millenbach Karen J | -- | -- |
Source: Public Records
Mortgage History
| Date | Status | Borrower | Loan Amount |
|---|---|---|---|
| Open | Jameson Scott | $179,120 | |
| Previous Owner | Millenbach Karen J | $124,000 |
Source: Public Records
Tax History
| Year | Tax Paid | Tax Assessment Tax Assessment Total Assessment is a certain percentage of the fair market value that is determined by local assessors to be the total taxable value of land and additions on the property. | Land | Improvement |
|---|---|---|---|---|
| 2025 | $3,024 | $576,900 | $256,600 | $320,300 |
| 2024 | $3,024 | $566,900 | $247,100 | $319,800 |
| 2023 | $2,841 | $531,600 | $237,500 | $294,100 |
| 2022 | $2,921 | $537,700 | $232,900 | $304,800 |
| 2021 | $2,599 | $407,300 | $176,800 | $230,500 |
| 2020 | $2,273 | $336,100 | $176,800 | $159,300 |
| 2019 | $2,199 | $317,200 | $166,800 | $150,400 |
| 2016 | $1,871 | $261,000 | $150,300 | $110,700 |
Source: Public Records
Map
Nearby Homes
- 9078 S Daybreak Dr
- 2156 E Falcon Way
- 2333 Cliff Swallow Dr
- 8921 S Shady Meadow Dr
- 2329 E Woodchuck Cir
- 1924 E Viscounti Cove
- 1990 E Terra Vista Way
- 8483 S Terrace Dr
- 9525 S Carriage Chase Ln
- 9472 Fox Hunt Dr
- 9457 S Fox Hunt Dr Unit 49
- 8931 Quail Hollow Dr
- 8638 Piper Ln
- 2691 E Partridge Cove
- 9472 S Tramway Dr
- 8698 S Alta Canyon Dr
- 9650 S Buttonwood Dr
- 8585 Mount Majestic Rd
- 2152 E Creek Rd
- 8597 Mount Majestic Rd
- 8957 S Buckingham Way
- 8957 Buckingham Way
- 2132 Buckingham Way
- 2139 Meadow Lark Way
- 8966 Powder Horn Ct
- 8966 S Powder Horn Ct
- 2147 E Meadow Lark Way
- 2147 Meadow Lark Way
- 2131 E Meadow Lark Way
- 2131 Meadow Lark Way
- 2139 Meadowlark Way
- 8972 S Powder Horn Ct
- 8972 Powder Horn Ct
- 2124 Buckingham Way
- 8954 Powder Horn Ct
- 8945 S Buckingham Way
- 8945 Buckingham Way
- 2133 Buckingham Way
- 2133 E Buckingham Way
- 2123 Meadow Lark Way
Your Personal Tour Guide
Ask me questions while you tour the home.