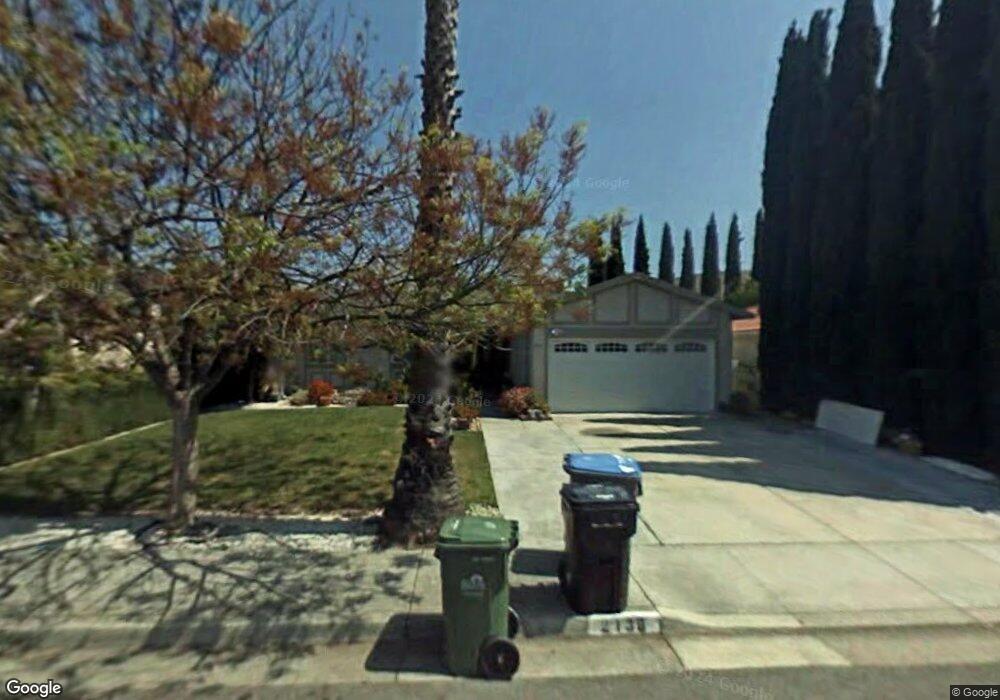
2138 Flintmore Ct San Jose, CA 95148
Mount Pleasant NeighborhoodEstimated Value: $1,201,000 - $1,477,000
3
Beds
2
Baths
1,361
Sq Ft
$978/Sq Ft
Est. Value
About This Home
This home is located at 2138 Flintmore Ct, San Jose, CA 95148 and is currently estimated at $1,331,164, approximately $978 per square foot. 2138 Flintmore Ct is a home located in Santa Clara County with nearby schools including Mt. Pleasant High School, Ida Jew Academies, and Adelante Dual Language Academy.
Ownership History
Date
Name
Owned For
Owner Type
Purchase Details
Closed on
Jan 25, 2022
Sold by
Xuan Tran Mai
Bought by
Mai Xuan Tran Revocable Living
Current Estimated Value
Purchase Details
Closed on
Jul 22, 2018
Sold by
Nguyen Giane Thanh and Nguyen Mai Xuan Tran
Bought by
Tran Mai Xuan
Home Financials for this Owner
Home Financials are based on the most recent Mortgage that was taken out on this home.
Original Mortgage
$450,000
Interest Rate
4.5%
Mortgage Type
New Conventional
Purchase Details
Closed on
Oct 13, 2006
Sold by
Tran Mai Xuan
Bought by
Tran Mai Xuan
Home Financials for this Owner
Home Financials are based on the most recent Mortgage that was taken out on this home.
Original Mortgage
$380,000
Interest Rate
6.39%
Mortgage Type
New Conventional
Purchase Details
Closed on
Jul 29, 2002
Sold by
Nguyen Giang Thanh and Tran Mai Xuan
Bought by
Tran Mai Xuan
Create a Home Valuation Report for This Property
The Home Valuation Report is an in-depth analysis detailing your home's value as well as a comparison with similar homes in the area
Home Values in the Area
Average Home Value in this Area
Purchase History
| Date | Buyer | Sale Price | Title Company |
|---|---|---|---|
| Mai Xuan Tran Revocable Living | -- | Vusa Law Offices | |
| Tran Mai Xuan | -- | None Available | |
| Tran Mai Xuan | -- | First American Title Company | |
| Tran Mai Xuan | -- | -- |
Source: Public Records
Mortgage History
| Date | Status | Borrower | Loan Amount |
|---|---|---|---|
| Previous Owner | Tran Mai Xuan | $450,000 | |
| Previous Owner | Tran Mai Xuan | $380,000 |
Source: Public Records
Tax History
| Year | Tax Paid | Tax Assessment Tax Assessment Total Assessment is a certain percentage of the fair market value that is determined by local assessors to be the total taxable value of land and additions on the property. | Land | Improvement |
|---|---|---|---|---|
| 2025 | $6,830 | $364,039 | $146,190 | $217,849 |
| 2024 | $6,830 | $356,902 | $143,324 | $213,578 |
| 2023 | $6,575 | $349,905 | $140,514 | $209,391 |
| 2022 | $6,404 | $343,045 | $137,759 | $205,286 |
| 2021 | $6,333 | $336,319 | $135,058 | $201,261 |
| 2020 | $5,947 | $332,872 | $133,674 | $199,198 |
| 2019 | $5,762 | $326,346 | $131,053 | $195,293 |
| 2018 | $5,594 | $319,948 | $128,484 | $191,464 |
| 2017 | $5,506 | $313,675 | $125,965 | $187,710 |
| 2016 | $5,324 | $307,526 | $123,496 | $184,030 |
| 2015 | $5,312 | $302,907 | $121,641 | $181,266 |
| 2014 | $4,458 | $296,975 | $119,259 | $177,716 |
Source: Public Records
Map
Nearby Homes
- 3455 Cuesta Dr
- 3410 Gila Dr
- 3485 Rubion Ct
- 3623 Westview Dr
- 3633 Westview Dr
- 2030 Flintbury Ct
- 2363 Pleasant Acres Dr
- 1710 Alder Creek Ct
- 3630 Eastridge Dr
- 3165 Coldwater Dr
- 2409 Klein Rd
- 3248 Rocky Mountain Dr
- 1542 Harvest Dr
- 2571 Gumdrop Dr
- 3282 Mount Everest Dr
- 3381 Mount Everest Dr
- 3515 Pine Ridge Way
- 2868 Ruby View
- 3611 Groesbeck Hill Dr
- 2836 Broken Oak Ct
- 2144 Flintmore Ct
- 2132 Flintmore Ct
- 3537 Cuesta Dr
- 3541 Cuesta Dr
- 2128 Flintmore Ct
- 2148 Flintmore Ct
- 3533 Cuesta Dr
- 3545 Cuesta Dr
- 2139 Flintmore Ct
- 2133 Flintmore Ct
- 2145 Flintmore Ct
- 3529 Cuesta Dr
- 2154 Flintmore Ct
- 3549 Cuesta Dr
- 2129 Flintmore Ct
- 2149 Flintmore Ct
- 2122 Flintmore Ct
- 3525 Cuesta Dr
- 3553 Cuesta Dr
- 2160 Flintmore Ct
Your Personal Tour Guide
Ask me questions while you tour the home.