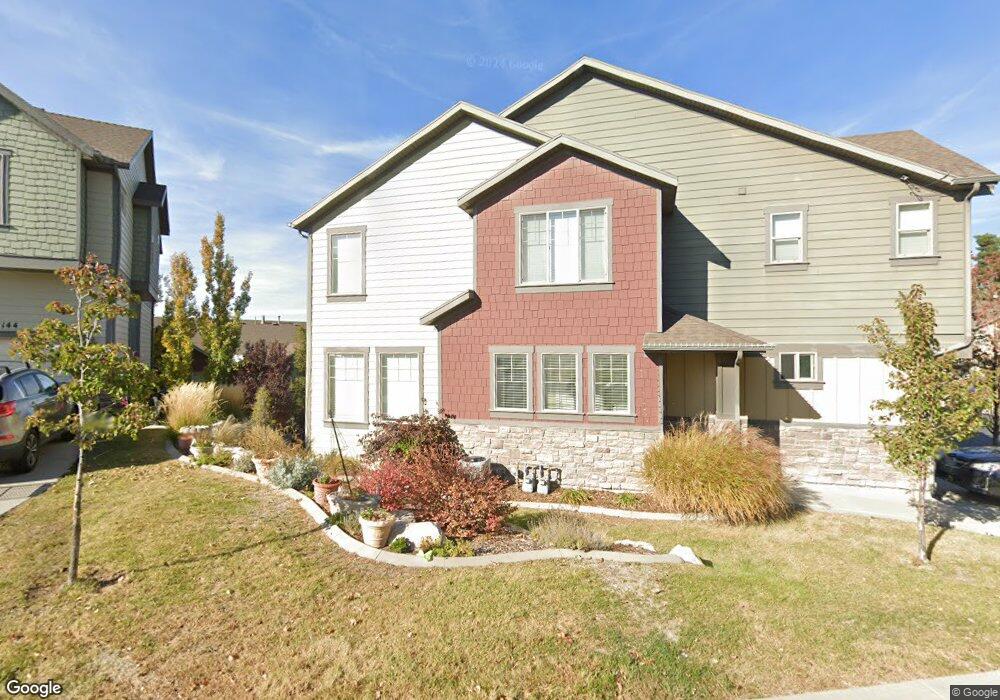
2138 Orchard Pines Loop Bountiful, UT 84010
Estimated Value: $467,000 - $506,000
3
Beds
4
Baths
2,358
Sq Ft
$207/Sq Ft
Est. Value
About This Home
This home is located at 2138 Orchard Pines Loop, Bountiful, UT 84010 and is currently estimated at $488,150, approximately $207 per square foot. 2138 Orchard Pines Loop is a home located in Davis County with nearby schools including Muir School, Mueller Park Junior High School, and Bountiful High School.
Ownership History
Date
Name
Owned For
Owner Type
Purchase Details
Closed on
Aug 31, 2020
Sold by
Hunsaker Nicholas K
Bought by
Hunsaker Nick and Hunsaker Charles L
Current Estimated Value
Home Financials for this Owner
Home Financials are based on the most recent Mortgage that was taken out on this home.
Original Mortgage
$201,800
Outstanding Balance
$179,011
Interest Rate
3%
Mortgage Type
New Conventional
Estimated Equity
$309,139
Purchase Details
Closed on
Jun 9, 2017
Sold by
Hunsaker Nick
Bought by
Hunsaker Nick and Hunsaker Charles L
Purchase Details
Closed on
Aug 9, 2013
Sold by
Stonekeep Llc
Bought by
Sloan Zachary and Sloan Danielle
Home Financials for this Owner
Home Financials are based on the most recent Mortgage that was taken out on this home.
Original Mortgage
$209,285
Interest Rate
4.28%
Mortgage Type
New Conventional
Create a Home Valuation Report for This Property
The Home Valuation Report is an in-depth analysis detailing your home's value as well as a comparison with similar homes in the area
Purchase History
| Date | Buyer | Sale Price | Title Company |
|---|---|---|---|
| Hunsaker Nick | -- | Accommodation | |
| Hunsaker Nicholas K | -- | Cottonwood Title Ins Age | |
| Hunsaker Nick | -- | Cottonwood Title | |
| Hunsaker Nick | -- | -- | |
| Sloan Zachary | -- | Access Title Company |
Source: Public Records
Mortgage History
| Date | Status | Borrower | Loan Amount |
|---|---|---|---|
| Open | Hunsaker Nicholas K | $201,800 | |
| Previous Owner | Sloan Zachary | $209,285 |
Source: Public Records
Tax History
| Year | Tax Paid | Tax Assessment Tax Assessment Total Assessment is a certain percentage of the fair market value that is determined by local assessors to be the total taxable value of land and additions on the property. | Land | Improvement |
|---|---|---|---|---|
| 2025 | $2,750 | $262,900 | $74,800 | $188,100 |
| 2024 | $2,611 | $254,100 | $54,450 | $199,650 |
| 2023 | $2,655 | $469,000 | $97,000 | $372,000 |
| 2022 | $2,814 | $272,800 | $55,000 | $217,800 |
| 2021 | $2,661 | $395,000 | $74,000 | $321,000 |
| 2020 | $2,342 | $350,000 | $71,000 | $279,000 |
| 2019 | $2,277 | $332,000 | $56,000 | $276,000 |
| 2018 | $2,074 | $298,000 | $55,000 | $243,000 |
| 2016 | $1,798 | $139,865 | $30,250 | $109,615 |
| 2015 | $1,570 | $114,895 | $30,250 | $84,645 |
| 2014 | $1,693 | $127,555 | $18,333 | $109,222 |
| 2013 | -- | $31,000 | $31,000 | $0 |
Source: Public Records
Map
Nearby Homes
- 188 E 2050 S Unit D3
- 2064 S Orchard Dr
- 320 E 2100 S
- 2046 S 350 E Unit 4
- 2038 S 350 E Unit 3
- 291 E 1950 S
- 2 E Wicker Ln
- 2059 S 350 E Unit 6
- 33 W Wicker Ln
- 19 E North Canyon Rd
- 69 E North Canyon Rd
- 53 W 1800 S
- 1820 S 50 W
- 1886 S Jeri Dr
- 438 E 1800 S
- 288 E 1650 S
- 141 E 1650 S
- 626 E 2150 S
- 1950 S 200 W Unit 32
- 304 W 2300 S
- 2130 Orchard Pines Loop
- 2124 Orchard Pines Loop
- 2144 Orchard Pines Loop
- 2144 Orchard Pines Loop
- 2150 Orchard Pines Loop
- 2169 Orchard Pines Loop
- 2169 Orchard Pines Loop
- 2116 Orchard Pines Loop
- 2147 Orchard Pines Loop
- 2139 Orchard Pines Loop
- 2133 Orchard Pines Loop
- 2177 Orchard Pines Loop
- 2162 Orchard Pines Loop
- 2162 Orchard Pines Loop
- 2121 Orchard Pines Loop Unit 33
- 2115 Orchard Pines Loop Unit 34
- 2119 Orchard Pines Loop
- 2127 Orchard Pines Loop Unit 32
- 2170 Orchard Pines Loop
- 2170 Orchard Pines Loop
Your Personal Tour Guide
Ask me questions while you tour the home.