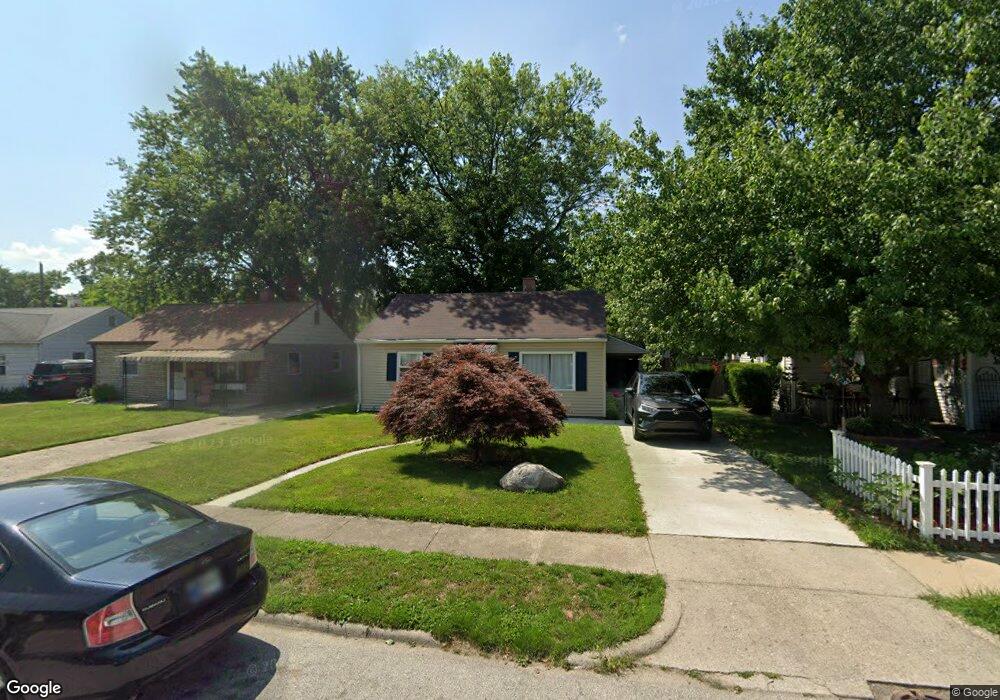
2138 Ulen Ln Lafayette, IN 47904
Vinton NeighborhoodEstimated Value: $82,000 - $185,000
--
Bed
--
Bath
840
Sq Ft
$167/Sq Ft
Est. Value
About This Home
This home is located at 2138 Ulen Ln, Lafayette, IN 47904 and is currently estimated at $140,495, approximately $167 per square foot. 2138 Ulen Ln is a home located in Tippecanoe County with nearby schools including Vinton Elementary School, Sunnyside Intermediate School, and Lafayette Tecumseh Junior High School.
Ownership History
Date
Name
Owned For
Owner Type
Purchase Details
Closed on
Dec 22, 2021
Sold by
Gladden Patrick
Bought by
Rmpg Properties Llc
Current Estimated Value
Purchase Details
Closed on
Feb 16, 2021
Sold by
Barron Ikie L
Bought by
Gladden Patrick
Home Financials for this Owner
Home Financials are based on the most recent Mortgage that was taken out on this home.
Original Mortgage
$36,000
Interest Rate
2.65%
Mortgage Type
New Conventional
Purchase Details
Closed on
Apr 22, 2002
Sold by
Pearson Dallas G and Pearson Doris A
Bought by
Barron Ikie L
Home Financials for this Owner
Home Financials are based on the most recent Mortgage that was taken out on this home.
Original Mortgage
$63,000
Interest Rate
8.75%
Mortgage Type
Purchase Money Mortgage
Create a Home Valuation Report for This Property
The Home Valuation Report is an in-depth analysis detailing your home's value as well as a comparison with similar homes in the area
Home Values in the Area
Average Home Value in this Area
Purchase History
| Date | Buyer | Sale Price | Title Company |
|---|---|---|---|
| Rmpg Properties Llc | -- | None Listed On Document | |
| Gladden Patrick | -- | Columbia Title | |
| Barron Ikie L | -- | Direct Title Agency |
Source: Public Records
Mortgage History
| Date | Status | Borrower | Loan Amount |
|---|---|---|---|
| Previous Owner | Gladden Patrick | $36,000 | |
| Previous Owner | Barron Ikie L | $63,000 |
Source: Public Records
Tax History Compared to Growth
Tax History
| Year | Tax Paid | Tax Assessment Tax Assessment Total Assessment is a certain percentage of the fair market value that is determined by local assessors to be the total taxable value of land and additions on the property. | Land | Improvement |
|---|---|---|---|---|
| 2024 | $1,756 | $87,800 | $13,000 | $74,800 |
| 2023 | $1,498 | $74,900 | $13,000 | $61,900 |
| 2022 | $1,434 | $71,700 | $13,000 | $58,700 |
| 2021 | $1,280 | $64,000 | $13,000 | $51,000 |
| 2020 | $1,216 | $60,800 | $13,000 | $47,800 |
| 2019 | $1,126 | $56,300 | $10,000 | $46,300 |
| 2018 | $263 | $55,200 | $10,000 | $45,200 |
| 2017 | $259 | $55,100 | $10,000 | $45,100 |
| 2016 | $261 | $56,500 | $10,000 | $46,500 |
| 2014 | $244 | $54,300 | $10,000 | $44,300 |
| 2013 | $229 | $52,300 | $10,000 | $42,300 |
Source: Public Records
Map
Nearby Homes
- 2901 Elk St
- 3013 Darby Ln
- 3000 Underwood St
- 2007 N 27th St
- 2716 Longlois Dr
- 2211 N 24th St
- 1908 Whitcomb Ave
- 2226 N 23rd St
- 1729 Arlington Rd
- 2209 Monon Ave
- 2022 Elk St
- 2127 Perrine St
- 2107 Monon Ave
- 2101 Monon Ave
- 112 Peppertree Ct
- 2001 Schuyler Ave
- 2340 N 20th St
- 1400 N 28th St
- 1325 Hedgewood Dr
- 2215 N 18th St