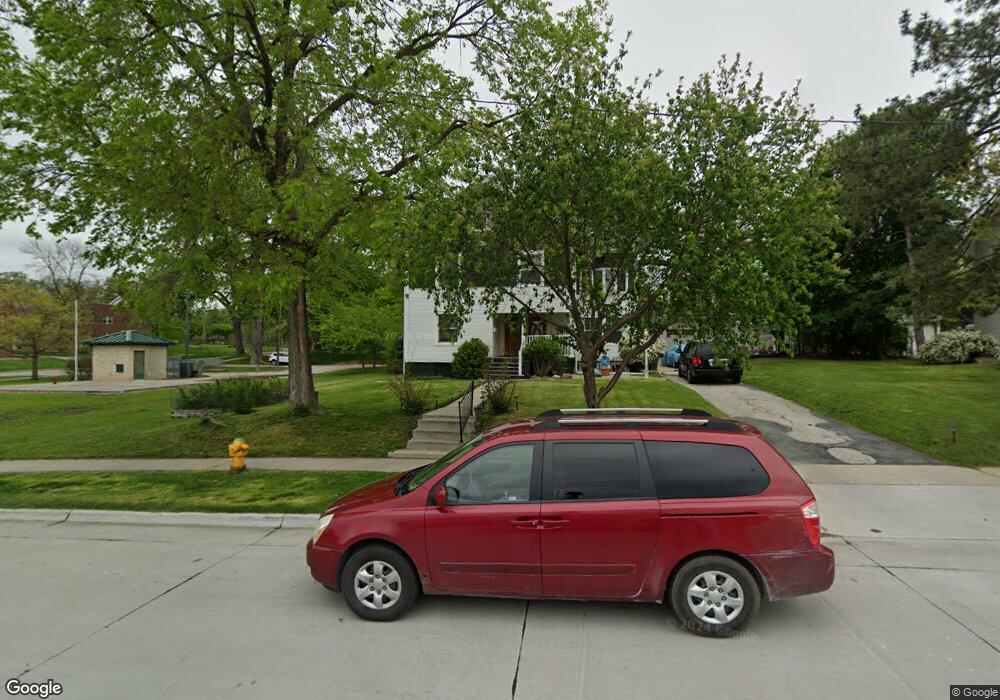
2139 High St Des Moines, IA 50312
Woodland Heights NeighborhoodEstimated Value: $435,000
5
Beds
5
Baths
3,368
Sq Ft
$129/Sq Ft
Est. Value
About This Home
This home is located at 2139 High St, Des Moines, IA 50312 and is currently estimated at $435,000, approximately $129 per square foot. 2139 High St is a home located in Polk County with nearby schools including Callanan Middle School, Central Campus - Main, and Roosevelt High School.
Ownership History
Date
Name
Owned For
Owner Type
Purchase Details
Closed on
Feb 5, 2007
Sold by
Fexsteve Ltd Co
Bought by
Williams Stephen H and Williams Felicia A
Current Estimated Value
Home Financials for this Owner
Home Financials are based on the most recent Mortgage that was taken out on this home.
Original Mortgage
$125,000
Outstanding Balance
$74,741
Interest Rate
6.22%
Mortgage Type
Construction
Estimated Equity
$360,259
Purchase Details
Closed on
Nov 3, 2006
Sold by
Iowa State Bank
Bought by
Henderson Gene L
Purchase Details
Closed on
Feb 2, 2006
Sold by
Henderson Gene L
Bought by
Fexsteve Ltd Co
Home Financials for this Owner
Home Financials are based on the most recent Mortgage that was taken out on this home.
Original Mortgage
$27,000
Interest Rate
8.5%
Mortgage Type
Seller Take Back
Purchase Details
Closed on
Jun 9, 2005
Sold by
Glh Enterprises Llc
Bought by
Henderson Gene L
Create a Home Valuation Report for This Property
The Home Valuation Report is an in-depth analysis detailing your home's value as well as a comparison with similar homes in the area
Home Values in the Area
Average Home Value in this Area
Purchase History
| Date | Buyer | Sale Price | Title Company |
|---|---|---|---|
| Williams Stephen H | -- | None Available | |
| Henderson Gene L | $30,000 | None Available | |
| Fexsteve Ltd Co | $30,000 | None Available | |
| Henderson Gene L | -- | -- |
Source: Public Records
Mortgage History
| Date | Status | Borrower | Loan Amount |
|---|---|---|---|
| Open | Williams Stephen H | $125,000 | |
| Previous Owner | Fexsteve Ltd Co | $27,000 |
Source: Public Records
Tax History
| Year | Tax Paid | Tax Assessment Tax Assessment Total Assessment is a certain percentage of the fair market value that is determined by local assessors to be the total taxable value of land and additions on the property. | Land | Improvement |
|---|---|---|---|---|
| 2025 | $8,170 | $482,100 | $41,000 | $441,100 |
| 2024 | $8,170 | $432,800 | $36,100 | $396,700 |
| 2023 | $7,668 | $432,800 | $36,100 | $396,700 |
| 2022 | $7,606 | $334,200 | $29,400 | $304,800 |
| 2021 | $7,242 | $334,200 | $29,400 | $304,800 |
| 2020 | $7,518 | $298,800 | $26,300 | $272,500 |
| 2019 | $7,140 | $298,800 | $26,300 | $272,500 |
| 2018 | $3,570 | $274,200 | $22,900 | $251,300 |
| 2017 | $1,546 | $274,200 | $22,900 | $251,300 |
| 2016 | $1,502 | $260,500 | $21,700 | $238,800 |
| 2015 | $1,502 | $260,500 | $21,700 | $238,800 |
| 2014 | $1,410 | $256,600 | $21,000 | $235,600 |
Source: Public Records
Map
Nearby Homes
Your Personal Tour Guide
Ask me questions while you tour the home.