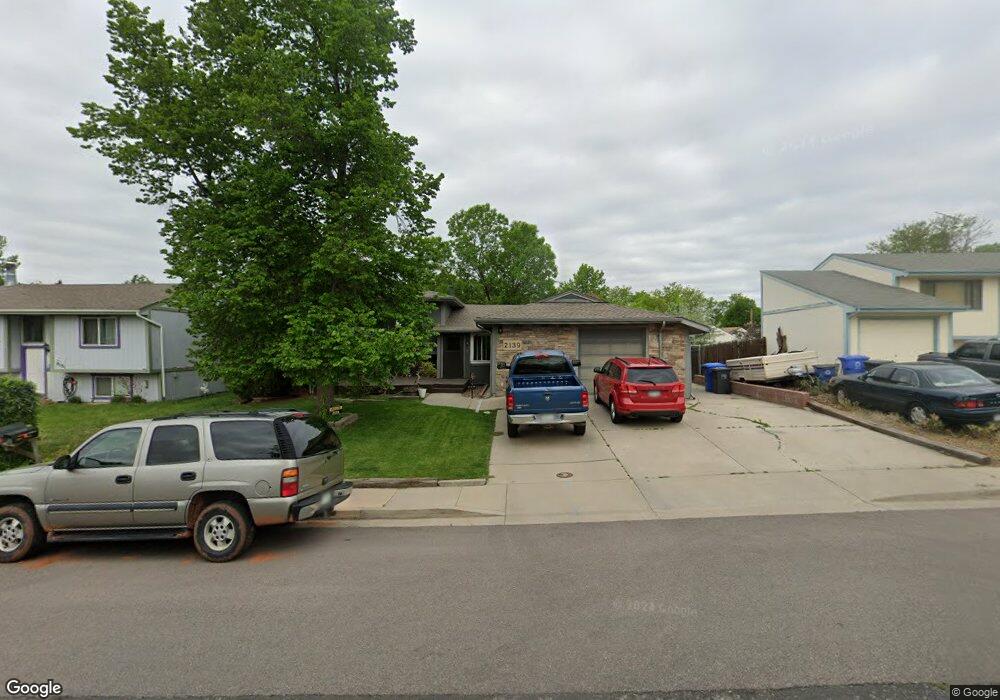
2139 S Duffield Ave Loveland, CO 80537
Estimated Value: $394,000 - $441,000
3
Beds
3
Baths
1,253
Sq Ft
$334/Sq Ft
Est. Value
About This Home
This home is located at 2139 S Duffield Ave, Loveland, CO 80537 and is currently estimated at $418,298, approximately $333 per square foot. 2139 S Duffield Ave is a home located in Larimer County with nearby schools including B. F. Kitchen Elementary School, Bill Reed Middle School, and Thompson Valley High School.
Ownership History
Date
Name
Owned For
Owner Type
Purchase Details
Closed on
Nov 11, 2002
Sold by
Cook Amity L
Bought by
Engelhardt Mark L and Engelhardt Amity L
Current Estimated Value
Home Financials for this Owner
Home Financials are based on the most recent Mortgage that was taken out on this home.
Original Mortgage
$124,000
Outstanding Balance
$47,531
Interest Rate
4.87%
Estimated Equity
$370,767
Purchase Details
Closed on
Aug 24, 1998
Sold by
Winchel Ronald E and Winchel Debra M
Bought by
Engelhardt Mark L and Cook Amity L
Home Financials for this Owner
Home Financials are based on the most recent Mortgage that was taken out on this home.
Original Mortgage
$126,877
Interest Rate
6.9%
Mortgage Type
FHA
Purchase Details
Closed on
Nov 12, 1996
Sold by
Winchel Ronald E and Faye Swan Debra M
Bought by
Winchel Ronald E and Winchel Debra M
Create a Home Valuation Report for This Property
The Home Valuation Report is an in-depth analysis detailing your home's value as well as a comparison with similar homes in the area
Home Values in the Area
Average Home Value in this Area
Purchase History
| Date | Buyer | Sale Price | Title Company |
|---|---|---|---|
| Engelhardt Mark L | -- | Chicago Title Co | |
| Engelhardt Mark L | $129,000 | -- | |
| Winchel Ronald E | -- | -- |
Source: Public Records
Mortgage History
| Date | Status | Borrower | Loan Amount |
|---|---|---|---|
| Open | Engelhardt Mark L | $124,000 | |
| Previous Owner | Engelhardt Mark L | $126,877 |
Source: Public Records
Tax History Compared to Growth
Tax History
| Year | Tax Paid | Tax Assessment Tax Assessment Total Assessment is a certain percentage of the fair market value that is determined by local assessors to be the total taxable value of land and additions on the property. | Land | Improvement |
|---|---|---|---|---|
| 2025 | $1,830 | $26,613 | $1,367 | $25,246 |
| 2024 | $1,765 | $26,613 | $1,367 | $25,246 |
| 2022 | $1,636 | $20,558 | $1,418 | $19,140 |
| 2021 | $1,681 | $21,150 | $1,459 | $19,691 |
| 2020 | $1,563 | $19,663 | $1,459 | $18,204 |
| 2019 | $1,537 | $19,663 | $1,459 | $18,204 |
| 2018 | $1,332 | $16,186 | $1,469 | $14,717 |
| 2017 | $1,147 | $16,186 | $1,469 | $14,717 |
| 2016 | $1,036 | $14,121 | $1,624 | $12,497 |
| 2015 | $1,027 | $14,120 | $1,620 | $12,500 |
| 2014 | $851 | $11,320 | $1,620 | $9,700 |
Source: Public Records
Map
Nearby Homes
- 2139 Donna Ct
- 1191 23rd St SW
- 913 21st St SW
- 2120 S Taft Ave
- 1101 20th St SW
- 1902 Diana Dr
- 1417 Glenda Ct
- 2240 Delia Ct
- 707 22nd St SW
- 1918 Cindy Ct
- 2318 S Colorado Ave
- 527 24th Place SW
- 0 SW 14th St Unit 949960
- 1264 Lavender Ct
- 1601 14th St SW
- 1687 Valency Dr
- 1679 Valency Dr
- 1673 Valency Dr
- 1157 Lavender Ave
- 1560 10th St SW
- 2127 S Duffield Ave
- 2151 S Duffield Ave
- 2138 Doris Ct
- 2126 Doris Ct
- 2150 Doris Ct
- 2115 S Duffield Ave
- 2138 S Duffield Ave
- 2150 S Duffield Ave
- 2126 S Duffield Ave
- 2114 Doris Ct
- 1142 22nd St SW
- 1154 22nd St SW
- 1142 SW 22nd St
- 2114 S Duffield Ave
- 1008 21st St SW
- 1012 21st St SW
- 1166 22nd St SW
- 1118 22nd St SW
- 1016 21st St SW
- 1208 22nd St SW