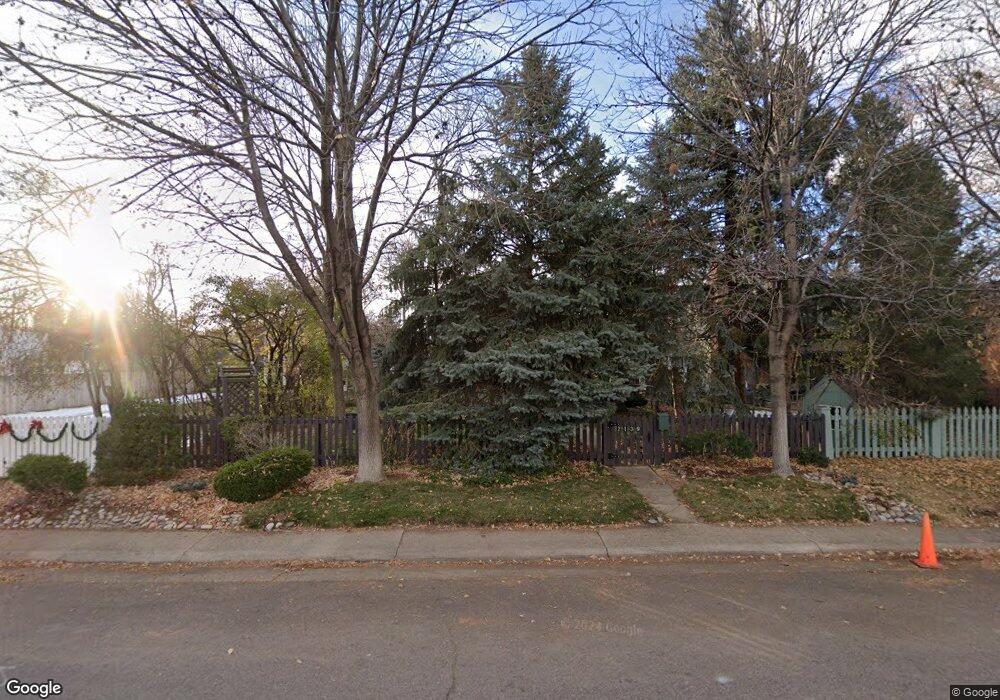
2139 S Pennsylvania St Denver, CO 80210
Rosedale NeighborhoodEstimated Value: $638,286 - $868,000
3
Beds
2
Baths
1,298
Sq Ft
$565/Sq Ft
Est. Value
About This Home
This home is located at 2139 S Pennsylvania St, Denver, CO 80210 and is currently estimated at $733,322, approximately $564 per square foot. 2139 S Pennsylvania St is a home located in Denver County with nearby schools including Asbury Elementary School, Grant Beacon Middle School, and South High School.
Ownership History
Date
Name
Owned For
Owner Type
Purchase Details
Closed on
Jun 4, 2024
Sold by
Richardson Leslie D and Richardson Lilly R
Bought by
Leslie Darnell Richardson Sr & Lily Rae Richa and Richardson
Current Estimated Value
Purchase Details
Closed on
Feb 13, 1997
Sold by
Kearns Piney P and Kearns Jay M
Bought by
Nye Richard F and Nye Leslie D
Home Financials for this Owner
Home Financials are based on the most recent Mortgage that was taken out on this home.
Original Mortgage
$100,000
Interest Rate
7.68%
Purchase Details
Closed on
Oct 15, 1996
Sold by
Mulcahy John C and Mulcahy Daniel
Bought by
Kearns Piney P and Kearns Jay M
Home Financials for this Owner
Home Financials are based on the most recent Mortgage that was taken out on this home.
Original Mortgage
$96,720
Interest Rate
10.25%
Purchase Details
Closed on
Oct 11, 1996
Sold by
Kolenc David A and Kolenc Kathleen Ann
Bought by
Kolenc David A
Home Financials for this Owner
Home Financials are based on the most recent Mortgage that was taken out on this home.
Original Mortgage
$96,720
Interest Rate
10.25%
Purchase Details
Closed on
Feb 7, 1985
Sold by
Mulcahy John N
Bought by
Mulcahy John and Mulcahy Daniel
Create a Home Valuation Report for This Property
The Home Valuation Report is an in-depth analysis detailing your home's value as well as a comparison with similar homes in the area
Home Values in the Area
Average Home Value in this Area
Purchase History
| Date | Buyer | Sale Price | Title Company |
|---|---|---|---|
| Leslie Darnell Richardson Sr & Lily Rae Richa | -- | None Listed On Document | |
| Nye Richard F | $157,500 | -- | |
| Kearns Piney P | $110,000 | -- | |
| Kolenc David A | -- | -- | |
| Mulcahy John | -- | -- |
Source: Public Records
Mortgage History
| Date | Status | Borrower | Loan Amount |
|---|---|---|---|
| Previous Owner | Nye Richard F | $100,000 | |
| Previous Owner | Kearns Piney P | $96,720 |
Source: Public Records
Tax History Compared to Growth
Tax History
| Year | Tax Paid | Tax Assessment Tax Assessment Total Assessment is a certain percentage of the fair market value that is determined by local assessors to be the total taxable value of land and additions on the property. | Land | Improvement |
|---|---|---|---|---|
| 2024 | $2,587 | $39,360 | $26,320 | $13,040 |
| 2023 | $2,531 | $39,360 | $26,320 | $13,040 |
| 2022 | $2,269 | $35,480 | $30,020 | $5,460 |
| 2021 | $2,190 | $36,500 | $30,880 | $5,620 |
| 2020 | $2,118 | $35,700 | $28,590 | $7,110 |
| 2019 | $2,059 | $35,700 | $28,590 | $7,110 |
| 2018 | $1,453 | $25,980 | $19,580 | $6,400 |
| 2017 | $1,449 | $25,980 | $19,580 | $6,400 |
| 2016 | $1,329 | $24,260 | $20,370 | $3,890 |
| 2015 | $1,273 | $24,260 | $20,370 | $3,890 |
| 2014 | $1,002 | $20,020 | $15,275 | $4,745 |
Source: Public Records
Map
Nearby Homes
- 2157 S Logan St
- 2163 S Grant St
- 2177 S Grant St
- 2070 S Grant St
- 2137 S Washington St
- 2174 S Sherman St Unit 2176
- 2194 S Sherman St
- 2140 S Washington St
- 2275 S Grant St Unit E2275
- 2060 S Washington St
- 2175 S Clarkson St
- 1992 S Grant St
- 2082 S Lincoln St
- 2281 S Sherman St
- 2034 S Lincoln St
- 2026 S Lincoln St
- 1941 S Pearl St
- 2251 S Emerson St
- 1927 S Grant St
- 2176 S Emerson St
- 2127 S Pennsylvania St
- 2125 S Pennsylvania St
- 2143 S Pennsylvania St
- 2115 S Pennsylvania St
- 2145 S Pennsylvania St Unit 2147
- 2155 S Pennsylvania St
- 2134 S Logan St
- 2116 S Logan St
- 2140 S Logan St
- 2112 S Logan St
- 2101 S Pennsylvania St
- 2150 S Logan St
- 2167 S Pennsylvania St
- 2110 S Logan St
- 432 E Evans Ave
- 2156 S Logan St
- 2100 S Logan St
- 2160 S Logan St
- 2179 S Pennsylvania St
- 2170 S Logan St