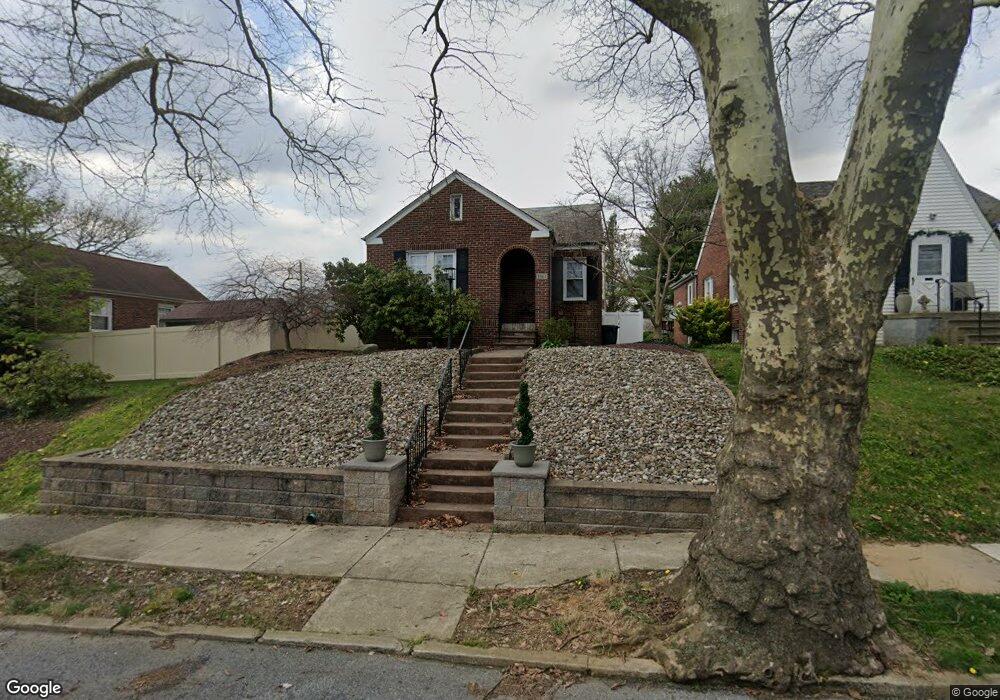
2139 W Greenleaf St Unit 2141 Allentown, PA 18104
West End Allentown NeighborhoodEstimated Value: $266,000 - $329,000
3
Beds
2
Baths
1,222
Sq Ft
$245/Sq Ft
Est. Value
About This Home
This home is located at 2139 W Greenleaf St Unit 2141, Allentown, PA 18104 and is currently estimated at $299,412, approximately $245 per square foot. 2139 W Greenleaf St Unit 2141 is a home located in Lehigh County with nearby schools including Muhlenberg Elementary School, San Rafael Junior High School, and Trexler Middle School.
Ownership History
Date
Name
Owned For
Owner Type
Purchase Details
Closed on
Jan 3, 2018
Sold by
Deschoolmeester Stephanie
Bought by
Deschoolmeester Michael
Current Estimated Value
Purchase Details
Closed on
Jun 13, 2003
Sold by
Martinez Leandro Alberto and Musselman Sherri Ann
Bought by
Fey Stephanie and Deschoolmeester Michael J
Home Financials for this Owner
Home Financials are based on the most recent Mortgage that was taken out on this home.
Original Mortgage
$108,400
Outstanding Balance
$47,450
Interest Rate
5.77%
Mortgage Type
Purchase Money Mortgage
Estimated Equity
$251,962
Purchase Details
Closed on
Aug 15, 1996
Sold by
Hoffman Cindy Ann
Bought by
Musselman Sherri A
Purchase Details
Closed on
May 18, 1992
Sold by
Ross Cindy Ann
Bought by
Hoffman Cindy Ann
Purchase Details
Closed on
Aug 23, 1988
Bought by
Ross Cindy Ann
Create a Home Valuation Report for This Property
The Home Valuation Report is an in-depth analysis detailing your home's value as well as a comparison with similar homes in the area
Home Values in the Area
Average Home Value in this Area
Purchase History
| Date | Buyer | Sale Price | Title Company |
|---|---|---|---|
| Deschoolmeester Michael | -- | None Available | |
| Fey Stephanie | $135,500 | -- | |
| Musselman Sherri A | $80,500 | -- | |
| Hoffman Cindy Ann | -- | -- | |
| Ross Cindy Ann | $125,000 | -- |
Source: Public Records
Mortgage History
| Date | Status | Borrower | Loan Amount |
|---|---|---|---|
| Open | Fey Stephanie | $108,400 |
Source: Public Records
Tax History Compared to Growth
Tax History
| Year | Tax Paid | Tax Assessment Tax Assessment Total Assessment is a certain percentage of the fair market value that is determined by local assessors to be the total taxable value of land and additions on the property. | Land | Improvement |
|---|---|---|---|---|
| 2025 | $4,449 | $133,100 | $17,800 | $115,300 |
| 2024 | $4,449 | $133,100 | $17,800 | $115,300 |
| 2023 | $4,449 | $133,100 | $17,800 | $115,300 |
| 2022 | $4,298 | $133,100 | $115,300 | $17,800 |
| 2021 | $4,214 | $133,100 | $17,800 | $115,300 |
| 2020 | $4,107 | $133,100 | $17,800 | $115,300 |
| 2019 | $4,043 | $133,100 | $17,800 | $115,300 |
| 2018 | $3,756 | $133,100 | $17,800 | $115,300 |
| 2017 | $3,663 | $133,100 | $17,800 | $115,300 |
| 2016 | -- | $133,100 | $17,800 | $115,300 |
| 2015 | -- | $133,100 | $17,800 | $115,300 |
| 2014 | -- | $133,100 | $17,800 | $115,300 |
Source: Public Records
Map
Nearby Homes
- 2150 W Livingston St
- 1017 N 21st St
- 2023 W Washington St
- 2014 W Highland St
- 1135 N 23rd St
- 2328 W Congress St
- 2403 W Tremont St
- 614 N 23rd St
- 1246 N 22nd St
- 525 N Leh St
- 1802 W Washington St
- 2221 W Liberty St
- 921 N 26th St
- 1717 W Cedar St
- 1221 N 25th St Unit 1225
- 1243 N 19th St
- 518 N Saint George St
- 2133 W Gordon St Unit 2135
- 519 N Saint George St
- 2626 W Livingston St Unit 2636
- 2137 W Greenleaf St
- 2143 W Greenleaf St Unit 2151
- 2151 W Greenleaf St
- 2127 W Greenleaf St
- 913 N 22nd St Unit 919
- 914 N Saint Lucas St Unit 918
- 2140 W Greenleaf St
- 921 N 22nd St Unit 923
- 2134-2138 Greenleaf St
- 2134 W Greenleaf St Unit 2138
- 920 N Saint Lucas St Unit 926
- 2130 W Greenleaf St
- 2146 W Greenleaf St Unit 2152
- 2150 Greenleaf St
- 2203 W Greenleaf St
- 923 N 22nd St
- 2128 W Greenleaf St Unit 2132
- 2121 W Greenleaf St Unit 2125
- 925 N 22nd St Unit 929
- 2209 W Greenleaf St