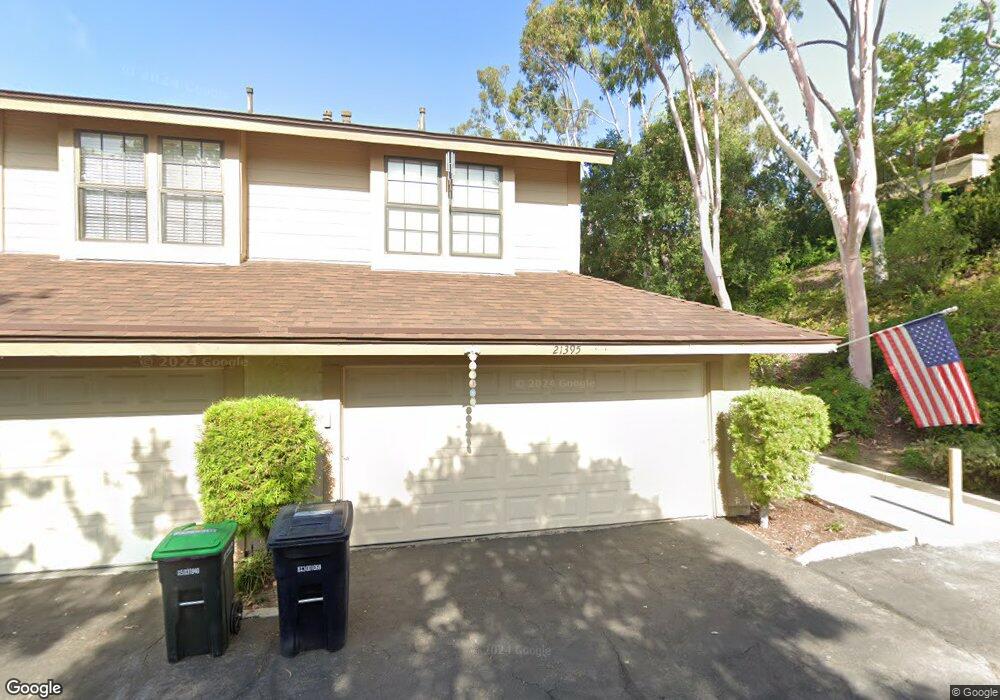
21395 Cypresswood Unit 82 Lake Forest, CA 92630
Estimated Value: $766,000 - $873,000
2
Beds
2
Baths
1,294
Sq Ft
$632/Sq Ft
Est. Value
About This Home
This home is located at 21395 Cypresswood Unit 82, Lake Forest, CA 92630 and is currently estimated at $818,336, approximately $632 per square foot. 21395 Cypresswood Unit 82 is a home located in Orange County with nearby schools including Rancho Canada Elementary School, Serrano Intermediate School, and El Toro High School.
Ownership History
Date
Name
Owned For
Owner Type
Purchase Details
Closed on
Jul 19, 2005
Sold by
Carney John M
Bought by
Troxel Charles E and Toomey Brenda L
Current Estimated Value
Home Financials for this Owner
Home Financials are based on the most recent Mortgage that was taken out on this home.
Original Mortgage
$479,900
Outstanding Balance
$249,866
Interest Rate
5.62%
Mortgage Type
Purchase Money Mortgage
Estimated Equity
$568,470
Purchase Details
Closed on
Jun 9, 2004
Sold by
Carney John M
Bought by
Carney John M and John M Carney Trust
Purchase Details
Closed on
Apr 5, 1996
Sold by
Manning Christopher D and Manning Patricia L
Bought by
Carney John M
Home Financials for this Owner
Home Financials are based on the most recent Mortgage that was taken out on this home.
Original Mortgage
$127,900
Interest Rate
7.84%
Mortgage Type
FHA
Create a Home Valuation Report for This Property
The Home Valuation Report is an in-depth analysis detailing your home's value as well as a comparison with similar homes in the area
Home Values in the Area
Average Home Value in this Area
Purchase History
| Date | Buyer | Sale Price | Title Company |
|---|---|---|---|
| Troxel Charles E | $480,000 | -- | |
| Carney John M | -- | -- | |
| Carney John M | $132,000 | Orange Coast Title |
Source: Public Records
Mortgage History
| Date | Status | Borrower | Loan Amount |
|---|---|---|---|
| Open | Troxel Charles E | $479,900 | |
| Previous Owner | Carney John M | $127,900 |
Source: Public Records
Tax History Compared to Growth
Tax History
| Year | Tax Paid | Tax Assessment Tax Assessment Total Assessment is a certain percentage of the fair market value that is determined by local assessors to be the total taxable value of land and additions on the property. | Land | Improvement |
|---|---|---|---|---|
| 2025 | $6,690 | $655,813 | $495,987 | $159,826 |
| 2024 | $6,690 | $642,954 | $486,261 | $156,693 |
| 2023 | $6,532 | $630,348 | $476,727 | $153,621 |
| 2022 | $5,854 | $564,060 | $442,377 | $121,683 |
| 2021 | $5,736 | $553,000 | $433,702 | $119,298 |
| 2020 | $5,743 | $553,000 | $433,702 | $119,298 |
| 2019 | $5,741 | $553,000 | $433,702 | $119,298 |
| 2018 | $5,176 | $499,000 | $379,702 | $119,298 |
| 2017 | $4,679 | $452,000 | $332,702 | $119,298 |
| 2016 | $4,693 | $452,000 | $332,702 | $119,298 |
| 2015 | $4,314 | $415,000 | $295,702 | $119,298 |
| 2014 | $3,861 | $373,062 | $253,764 | $119,298 |
Source: Public Records
Map
Nearby Homes
- 21283 Tupelo Ln Unit 4
- 25162 Chestnutwood Unit 47
- 21472 Firwood Unit 9
- 21324 Balsam Ln
- 21231 Calle Sendero
- 25326 Elderwood
- 25271 Baja Mar
- 21205 Serra Vista Unit 42
- 25302 Vista Linda
- 25215 Avenida Pacifica Unit 44
- 21291 Calle Recreo
- 25225 Avenida Tranquila Unit 102
- 25572 Orchard Rim Ln
- 21016 Champlain
- 21802 Bass Lake Cir
- 25446 Yountville
- 21841 Zuni Dr
- 20981 Oakville Unit 35
- 21011 Marin Unit 103
- 17 Ponte
- 21401 Cypresswood
- 21405 Cypresswood
- 21411 Cypresswood Unit 79
- 25195 Grovewood Unit 83
- 21415 Cypresswood Unit 78
- 25172 Birch Grove Ln
- 25201 Grovewood Unit 84
- 25201 Grovewood
- 21421 Cypresswood Unit 77
- 25182 Birch Grove Ln Unit 2
- 25162 Birch Grove Ln Unit 2
- 25174 Birch Grove Ln Unit 3
- 25164 Birch Grove Ln Unit 4
- 25164 Birch Grove Ln
- 25205 Grovewood
- 21425 Cypresswood Unit 76
- 25176 Birch Grove Ln Unit 5
- 25184 Birch Grove Ln Unit 4
- 25166 Birch Grove Ln Unit 6
- 25166 Birch Grove Ln