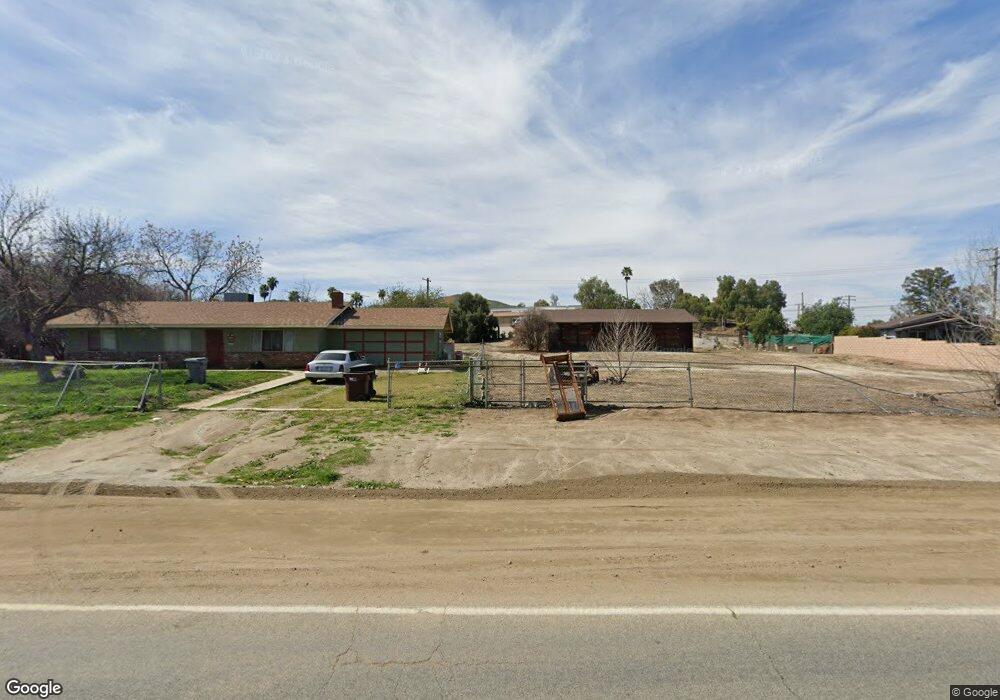
21395 Old Elsinore Rd Perris, CA 92570
Estimated Value: $446,000 - $531,000
3
Beds
2
Baths
1,125
Sq Ft
$441/Sq Ft
Est. Value
About This Home
This home is located at 21395 Old Elsinore Rd, Perris, CA 92570 and is currently estimated at $495,610, approximately $440 per square foot. 21395 Old Elsinore Rd is a home located in Riverside County with nearby schools including Columbia Elementary School, Tomas Rivera Middle School, and Citrus Hill High School.
Ownership History
Date
Name
Owned For
Owner Type
Purchase Details
Closed on
Mar 1, 2024
Sold by
Hoskin Rowl Cynthia
Bought by
Gonzalez Manuel Espinoza and Espinoza Liliana
Current Estimated Value
Home Financials for this Owner
Home Financials are based on the most recent Mortgage that was taken out on this home.
Original Mortgage
$332,500
Outstanding Balance
$325,740
Interest Rate
6.69%
Mortgage Type
New Conventional
Estimated Equity
$169,870
Purchase Details
Closed on
Apr 13, 1995
Sold by
California Central Trust Bank
Bought by
Hoskin Peter and Hoskin Cynthia E
Home Financials for this Owner
Home Financials are based on the most recent Mortgage that was taken out on this home.
Original Mortgage
$55,200
Interest Rate
8.51%
Mortgage Type
Purchase Money Mortgage
Purchase Details
Closed on
Oct 27, 1994
Sold by
Robles Juan Gerardo
Bought by
California Central Trust Bank Custodian and Cohan Lillian R
Purchase Details
Closed on
Sep 16, 1993
Sold by
Robles Juan Gerardo
Bought by
Martinez Frankie John and Martinez Yvonne
Create a Home Valuation Report for This Property
The Home Valuation Report is an in-depth analysis detailing your home's value as well as a comparison with similar homes in the area
Home Values in the Area
Average Home Value in this Area
Purchase History
| Date | Buyer | Sale Price | Title Company |
|---|---|---|---|
| Gonzalez Manuel Espinoza | $350,000 | None Listed On Document | |
| Gonzalez Manuel Espinoza | -- | None Listed On Document | |
| Hoskin Peter | $69,000 | Orange Coast Title Co | |
| California Central Trust Bank Custodian | $12,818 | North American Title Company | |
| Martinez Frankie John | -- | -- |
Source: Public Records
Mortgage History
| Date | Status | Borrower | Loan Amount |
|---|---|---|---|
| Open | Gonzalez Manuel Espinoza | $332,500 | |
| Previous Owner | Hoskin Peter | $55,200 |
Source: Public Records
Tax History
| Year | Tax Paid | Tax Assessment Tax Assessment Total Assessment is a certain percentage of the fair market value that is determined by local assessors to be the total taxable value of land and additions on the property. | Land | Improvement |
|---|---|---|---|---|
| 2025 | $1,321 | $459,000 | $137,700 | $321,300 |
| 2023 | $1,321 | $113,589 | $37,034 | $76,555 |
| 2022 | $1,282 | $111,362 | $36,308 | $75,054 |
| 2021 | $1,258 | $109,180 | $35,597 | $73,583 |
| 2020 | $1,245 | $108,061 | $35,232 | $72,829 |
| 2019 | $1,170 | $105,943 | $34,542 | $71,401 |
| 2018 | $1,154 | $103,866 | $33,865 | $70,001 |
| 2017 | $1,127 | $101,830 | $33,201 | $68,629 |
| 2016 | $1,114 | $99,834 | $32,550 | $67,284 |
| 2015 | $1,098 | $98,336 | $32,062 | $66,274 |
| 2014 | $1,085 | $96,412 | $31,435 | $64,977 |
Source: Public Records
Map
Nearby Homes
- 0 Marie Rd
- 22169 Rocky Hills Rd
- 22285 Old Elsinore Rd
- 0 Campos Rd Unit IV24176919
- 20920 Sawgo Dr
- 22340 Comet Ct
- 0 Aloha Rd Unit 2600318
- 20243 Lee Rd
- 23251 Placentia Ave
- 0 Old Elsinore Rd Unit DW25247795
- 21725 Pinewood St
- 20000 Carousel Dr
- 22440 San Jacinto Ave
- 22647 Cajalco Rd
- 23729 Citrus Ave
- 22738 La More Rd
- 20320 Roads End Dr
- 0 Vista Del Lago
- 23209 Norrisgrove Ave
- 0 Forrest Rd Unit SB24134281
- 21420 Old Elsinore Rd
- 21445 Old Elsinore Rd
- 21408 Old Elsinore Rd
- 21371 Old Elsinore Rd
- 0 Old El Sinore Rd Rd Unit C08070213
- 0 Elsinore Rd Unit PW17166266
- 21370 Old Elsinore Rd
- 21448 Old Elsinore Rd
- 0 Corina Dr
- 0 Corina Dr Unit IG21015556
- 0 Corina Dr Unit SW19045016
- 21455 Old Elsinore Rd
- 21321 Old Elsinore Rd
- 21481 Old Elsinore Rd
- 21358 Old Elsinore Rd
- 21470 Old Elsinore Rd
- 21981 Michael Rd
- 21501 Old Elsinore Rd
- 21280 Old Elsinore Rd
- 21518 Old Elsinore Rd
Your Personal Tour Guide
Ask me questions while you tour the home.