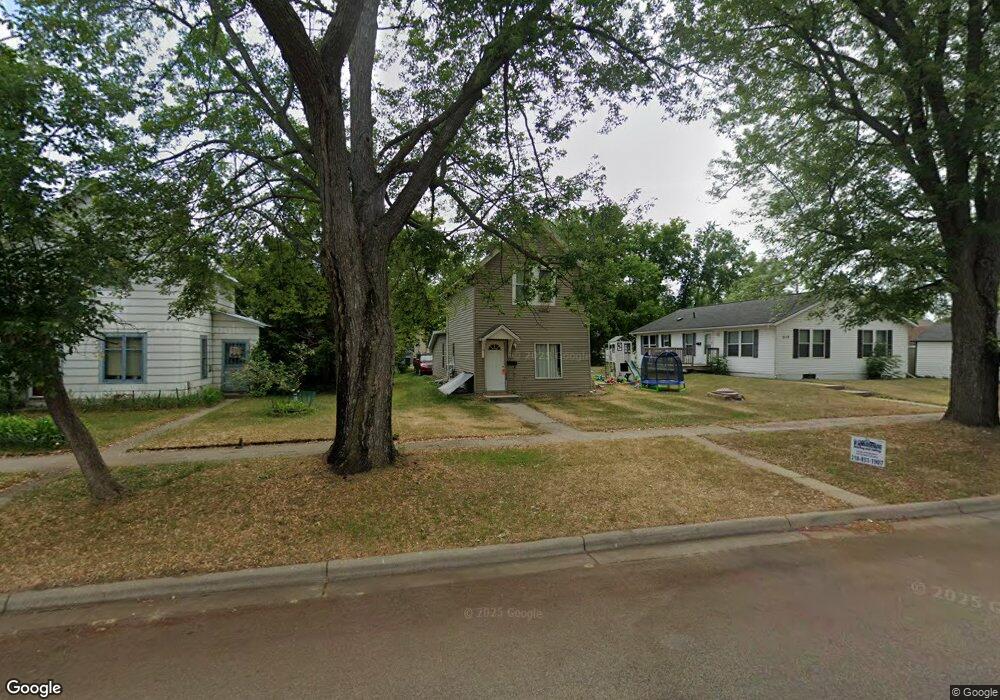
214 3rd Ave NE Brainerd, MN 56401
Estimated Value: $191,334 - $227,000
3
Beds
2
Baths
1,243
Sq Ft
$167/Sq Ft
Est. Value
About This Home
This home is located at 214 3rd Ave NE, Brainerd, MN 56401 and is currently estimated at $207,584, approximately $167 per square foot. 214 3rd Ave NE is a home located in Crow Wing County with nearby schools including Lowell Elementary School, Forestview Middle School, and Brainerd Senior High School.
Ownership History
Date
Name
Owned For
Owner Type
Purchase Details
Closed on
Aug 25, 2025
Sold by
Lorimor Dianna and Johnson Steven Robert
Bought by
Lorimor Investments Two Llc
Current Estimated Value
Purchase Details
Closed on
Sep 6, 2017
Sold by
Bement and Helene
Bought by
Lorimor Dianna C
Purchase Details
Closed on
Apr 1, 2010
Sold by
Bement La Verne and Bement Helene
Bought by
Lorimor Dianna
Purchase Details
Closed on
Apr 1, 2005
Sold by
Bement Laverne E and Bement Helene A
Bought by
Cleveland Chris and Cleveland Castillo, M
Purchase Details
Closed on
Oct 1, 1998
Sold by
Haugen Thomas D
Bought by
Bement Laverne and Bement H
Purchase Details
Closed on
Aug 1, 1995
Sold by
Junker Doug B
Bought by
Rehberger Danie
Create a Home Valuation Report for This Property
The Home Valuation Report is an in-depth analysis detailing your home's value as well as a comparison with similar homes in the area
Home Values in the Area
Average Home Value in this Area
Purchase History
| Date | Buyer | Sale Price | Title Company |
|---|---|---|---|
| Lorimor Investments Two Llc | $500 | None Listed On Document | |
| Lorimor Dianna C | $67,500 | -- | |
| Lorimor Dianna | $67,500 | -- | |
| Cleveland Chris | $95,900 | -- | |
| Bement Laverne | $42,000 | -- | |
| Rehberger Danie | $20,000 | -- |
Source: Public Records
Tax History
| Year | Tax Paid | Tax Assessment Tax Assessment Total Assessment is a certain percentage of the fair market value that is determined by local assessors to be the total taxable value of land and additions on the property. | Land | Improvement |
|---|---|---|---|---|
| 2025 | $1,926 | $176,400 | $44,300 | $132,100 |
| 2024 | $1,926 | $179,600 | $45,300 | $134,300 |
| 2023 | $1,684 | $167,000 | $41,800 | $125,200 |
| 2022 | $1,780 | $146,500 | $33,000 | $113,500 |
| 2021 | $1,738 | $123,500 | $31,100 | $92,400 |
| 2020 | $1,616 | $115,600 | $30,100 | $85,500 |
| 2019 | $1,488 | $102,400 | $30,100 | $72,300 |
| 2018 | $1,344 | $93,300 | $29,900 | $63,400 |
| 2017 | $1,262 | $89,200 | $29,900 | $59,300 |
| 2016 | $1,206 | $80,300 | $23,800 | $56,500 |
| 2015 | $1,040 | $69,500 | $18,800 | $50,700 |
| 2014 | $481 | $69,200 | $17,300 | $51,900 |
Source: Public Records
Map
Nearby Homes
Your Personal Tour Guide
Ask me questions while you tour the home.