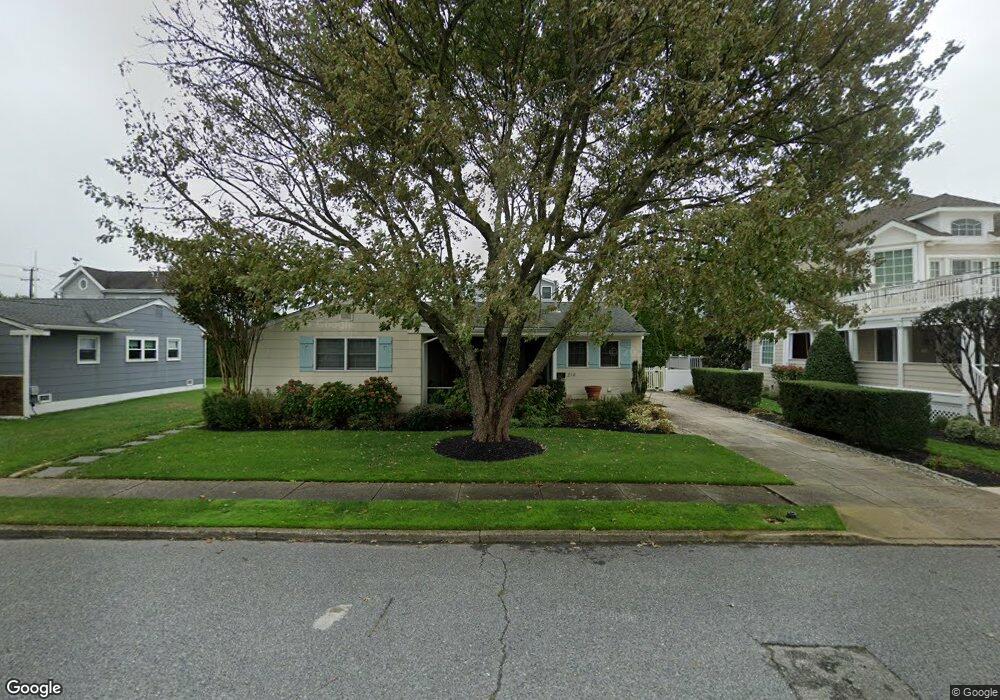
214 55th St Avalon, NJ 08202
Estimated Value: $2,237,000 - $3,400,000
--
Bed
--
Bath
1,460
Sq Ft
$1,902/Sq Ft
Est. Value
About This Home
This home is located at 214 55th St, Avalon, NJ 08202 and is currently estimated at $2,777,503, approximately $1,902 per square foot. 214 55th St is a home located in Cape May County with nearby schools including Avalon Elementary School.
Ownership History
Date
Name
Owned For
Owner Type
Purchase Details
Closed on
Aug 15, 2023
Sold by
Foster Jeffrey P and Foster Roberta F
Bought by
Yuengling Jennifer
Current Estimated Value
Purchase Details
Closed on
Jan 5, 2021
Sold by
Cavaliere Antonio
Bought by
Antonio Cavaliere Lt
Purchase Details
Closed on
Feb 21, 2007
Sold by
Raum John R and Raum Eleanor P
Bought by
Foster Jeffery P and Foster Roberta F
Home Financials for this Owner
Home Financials are based on the most recent Mortgage that was taken out on this home.
Original Mortgage
$797,120
Interest Rate
6.25%
Mortgage Type
Purchase Money Mortgage
Create a Home Valuation Report for This Property
The Home Valuation Report is an in-depth analysis detailing your home's value as well as a comparison with similar homes in the area
Home Values in the Area
Average Home Value in this Area
Purchase History
| Date | Buyer | Sale Price | Title Company |
|---|---|---|---|
| Yuengling Jennifer | $2,399,000 | None Listed On Document | |
| Yuengling Jennifer | $2,399,000 | None Listed On Document | |
| Antonio Cavaliere Lt | -- | None Available | |
| Foster Jeffery P | $996,400 | Chicago Title Insurance Co |
Source: Public Records
Mortgage History
| Date | Status | Borrower | Loan Amount |
|---|---|---|---|
| Previous Owner | Foster Jeffery P | $797,120 |
Source: Public Records
Tax History Compared to Growth
Tax History
| Year | Tax Paid | Tax Assessment Tax Assessment Total Assessment is a certain percentage of the fair market value that is determined by local assessors to be the total taxable value of land and additions on the property. | Land | Improvement |
|---|---|---|---|---|
| 2025 | $6,216 | $1,012,400 | $1,000,000 | $12,400 |
| 2024 | $6,216 | $1,012,400 | $1,000,000 | $12,400 |
| 2023 | $6,166 | $1,012,400 | $1,000,000 | $12,400 |
| 2022 | $5,750 | $1,012,400 | $1,000,000 | $12,400 |
| 2021 | $5,538 | $1,012,400 | $1,000,000 | $12,400 |
| 2020 | $5,325 | $1,012,400 | $1,000,000 | $12,400 |
| 2019 | $5,163 | $1,012,400 | $1,000,000 | $12,400 |
| 2018 | $4,941 | $1,012,400 | $1,000,000 | $12,400 |
| 2017 | $4,558 | $819,700 | $800,000 | $19,700 |
| 2016 | $4,508 | $819,700 | $800,000 | $19,700 |
| 2015 | $4,608 | $819,700 | $800,000 | $19,700 |
| 2014 | $4,385 | $819,700 | $800,000 | $19,700 |
Source: Public Records
Map
Nearby Homes