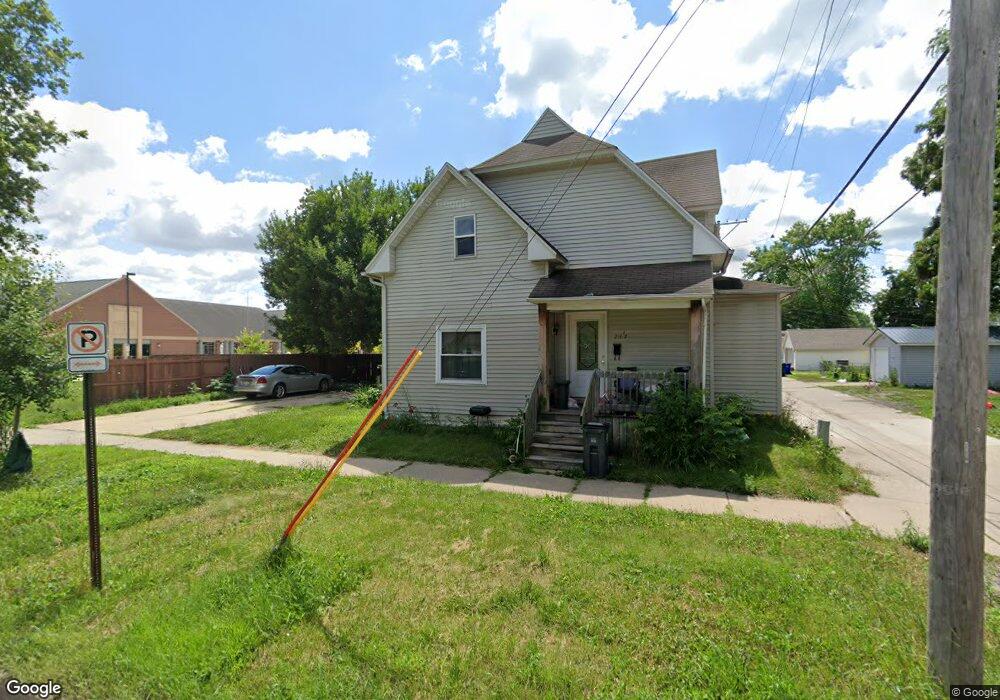
214 5th St NW Cedar Rapids, IA 52405
Northwest Area NeighborhoodEstimated Value: $98,000 - $110,989
4
Beds
2
Baths
1,413
Sq Ft
$75/Sq Ft
Est. Value
About This Home
This home is located at 214 5th St NW, Cedar Rapids, IA 52405 and is currently estimated at $105,330, approximately $74 per square foot. 214 5th St NW is a home located in Linn County with nearby schools including Junction City Elementary School, Harrison Elementary School, and Kentucky Tech - Ashland Reg Tech Center.
Ownership History
Date
Name
Owned For
Owner Type
Purchase Details
Closed on
Jan 18, 2010
Sold by
Us Bank National Association
Bought by
Baker Paul
Current Estimated Value
Purchase Details
Closed on
Nov 24, 2009
Sold by
Perkins Gary A and Perkins Tracy L
Bought by
Us Bank National Association
Purchase Details
Closed on
Apr 29, 2002
Sold by
Walter Jerry L and Walter Geri S
Bought by
Perkins Gary A and Perkins Tracy L
Home Financials for this Owner
Home Financials are based on the most recent Mortgage that was taken out on this home.
Original Mortgage
$48,600
Interest Rate
9.13%
Purchase Details
Closed on
Jun 29, 1999
Sold by
Lakin Carol E
Bought by
Walter Jerry L and Walter Geri S
Home Financials for this Owner
Home Financials are based on the most recent Mortgage that was taken out on this home.
Original Mortgage
$45,000
Interest Rate
7.29%
Create a Home Valuation Report for This Property
The Home Valuation Report is an in-depth analysis detailing your home's value as well as a comparison with similar homes in the area
Home Values in the Area
Average Home Value in this Area
Purchase History
| Date | Buyer | Sale Price | Title Company |
|---|---|---|---|
| Baker Paul | $13,500 | None Available | |
| Us Bank National Association | $91,718 | None Available | |
| Perkins Gary A | $53,500 | -- | |
| Walter Jerry L | $49,500 | -- |
Source: Public Records
Mortgage History
| Date | Status | Borrower | Loan Amount |
|---|---|---|---|
| Previous Owner | Perkins Gary A | $48,600 | |
| Previous Owner | Walter Jerry L | $45,000 |
Source: Public Records
Tax History Compared to Growth
Tax History
| Year | Tax Paid | Tax Assessment Tax Assessment Total Assessment is a certain percentage of the fair market value that is determined by local assessors to be the total taxable value of land and additions on the property. | Land | Improvement |
|---|---|---|---|---|
| 2025 | $1,316 | $103,100 | $22,700 | $80,400 |
| 2024 | $1,624 | $97,700 | $22,700 | $75,000 |
| 2023 | $1,624 | $74,400 | $22,700 | $51,700 |
| 2022 | $1,478 | $77,000 | $20,800 | $56,200 |
| 2021 | $1,392 | $71,300 | $20,800 | $50,500 |
| 2020 | $1,392 | $63,100 | $17,000 | $46,100 |
| 2019 | $974 | $45,200 | $11,300 | $33,900 |
| 2018 | $948 | $45,200 | $11,300 | $33,900 |
| 2017 | $988 | $45,400 | $11,300 | $34,100 |
| 2016 | $966 | $45,400 | $11,300 | $34,100 |
| 2015 | $976 | $45,895 | $11,340 | $34,555 |
| 2014 | $976 | $45,895 | $11,340 | $34,555 |
| 2013 | $956 | $45,895 | $11,340 | $34,555 |
Source: Public Records
Map
Nearby Homes