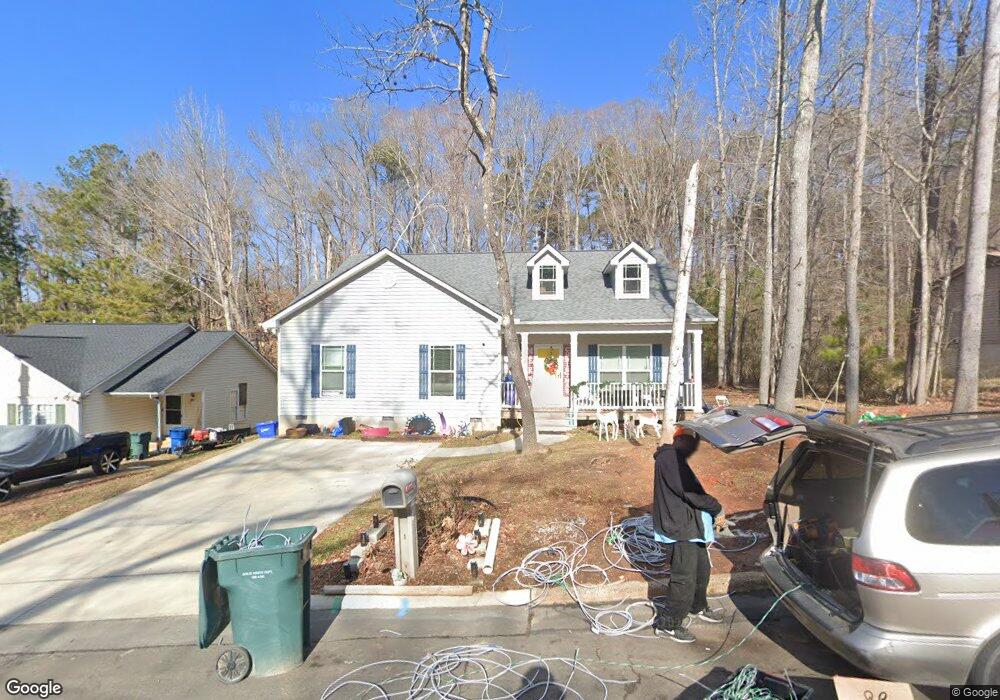
214 Cisco St Durham, NC 27707
Hope Valley NeighborhoodEstimated Value: $402,000 - $538,000
4
Beds
2
Baths
1,986
Sq Ft
$239/Sq Ft
Est. Value
About This Home
This home is located at 214 Cisco St, Durham, NC 27707 and is currently estimated at $474,109, approximately $238 per square foot. 214 Cisco St is a home with nearby schools including Morehead Montessori, Sherwood Githens Middle, and Jordan High School.
Ownership History
Date
Name
Owned For
Owner Type
Purchase Details
Closed on
Feb 2, 2024
Sold by
Nunn Love Latoya and Love Kevin J
Bought by
Nunn Love Latoya
Current Estimated Value
Purchase Details
Closed on
Mar 27, 2020
Sold by
Quick Tony R and Quick Doretha J
Bought by
Nunn Love Latoya D and Love Kevin
Home Financials for this Owner
Home Financials are based on the most recent Mortgage that was taken out on this home.
Original Mortgage
$270,019
Interest Rate
3.4%
Mortgage Type
FHA
Purchase Details
Closed on
May 29, 2018
Sold by
Hedgepeth Myka Michelle
Bought by
Quick Tony R and Quick Doretha J
Purchase Details
Closed on
Jun 27, 2006
Sold by
Counts Fannie
Bought by
Hedgepeth Myka Michelle
Purchase Details
Closed on
Jul 17, 2002
Sold by
Marshall Valorie and Marshall Eddie
Bought by
Counts Fannie
Create a Home Valuation Report for This Property
The Home Valuation Report is an in-depth analysis detailing your home's value as well as a comparison with similar homes in the area
Home Values in the Area
Average Home Value in this Area
Purchase History
| Date | Buyer | Sale Price | Title Company |
|---|---|---|---|
| Nunn Love Latoya | -- | None Listed On Document | |
| Nunn Love Latoya | -- | None Listed On Document | |
| Nunn Love Latoya D | $20,000 | None Available | |
| Quick Tony R | $10,000 | None Available | |
| Hedgepeth Myka Michelle | -- | None Available | |
| Counts Fannie | -- | -- |
Source: Public Records
Mortgage History
| Date | Status | Borrower | Loan Amount |
|---|---|---|---|
| Previous Owner | Nunn Love Latoya D | $270,019 |
Source: Public Records
Tax History Compared to Growth
Tax History
| Year | Tax Paid | Tax Assessment Tax Assessment Total Assessment is a certain percentage of the fair market value that is determined by local assessors to be the total taxable value of land and additions on the property. | Land | Improvement |
|---|---|---|---|---|
| 2025 | $4,190 | $461,521 | $93,825 | $367,696 |
| 2024 | $4,190 | $300,371 | $20,805 | $279,566 |
| 2023 | $3,935 | $300,371 | $20,805 | $279,566 |
| 2022 | $3,844 | $300,371 | $20,805 | $279,566 |
| 2021 | $3,826 | $300,371 | $20,805 | $279,566 |
| 2020 | $259 | $20,805 | $20,805 | $0 |
| 2019 | $259 | $20,805 | $20,805 | $0 |
| 2018 | $235 | $17,337 | $17,337 | $0 |
| 2017 | $233 | $17,337 | $17,337 | $0 |
| 2016 | $226 | $17,337 | $17,337 | $0 |
| 2015 | $308 | $22,220 | $22,220 | $0 |
| 2014 | $308 | $22,220 | $22,220 | $0 |
Source: Public Records
Map
Nearby Homes
- 126 Parquet St
- 114 Barnhill St
- 106 Montrose Dr
- 250 Barnhill St
- 2904 Wadsworth Ave Unit A
- 212 Barnhill St
- 180 Montrose Dr
- 2907 S Roxboro St
- 202 Selkirk Place
- 313 W Cornwallis Rd
- 2913 Wadsworth Ave
- 104 Archdale Dr
- 10 Hartford Ct
- 2146 Charles St Unit 12
- 2213 Alpine Rd
- 36 Burgess Ln
- 2221 Alpine Rd
- 2235 Alpine Rd
- 2828 Stuart Dr
- 3215 Oxford Dr