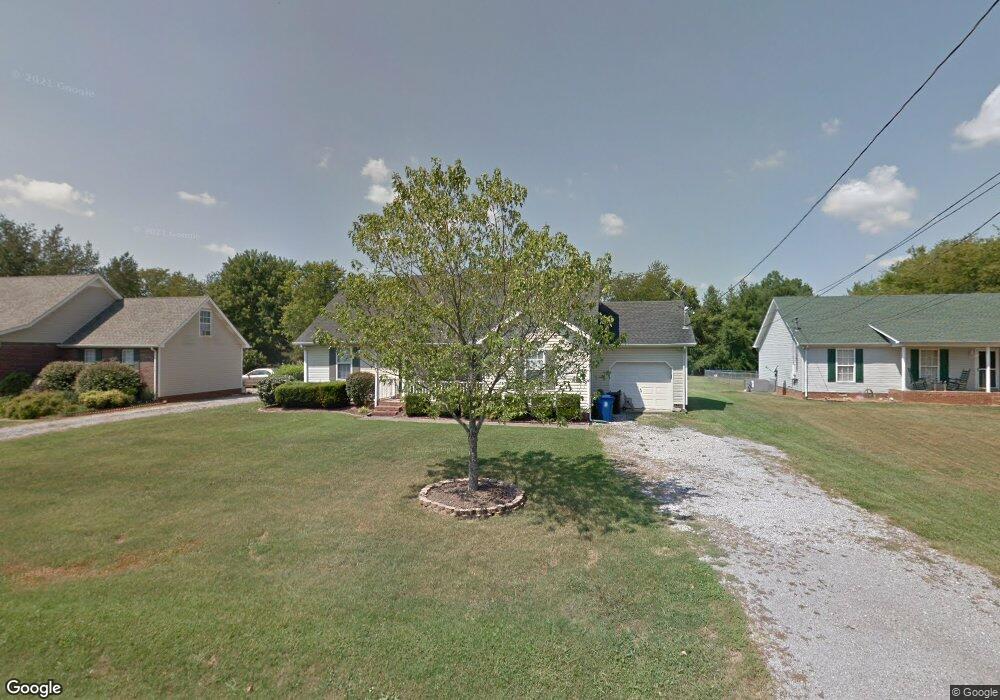
214 Conhocken Ct Murfreesboro, TN 37128
Estimated Value: $344,000 - $388,000
3
Beds
2
Baths
1,299
Sq Ft
$276/Sq Ft
Est. Value
About This Home
This home is located at 214 Conhocken Ct, Murfreesboro, TN 37128 and is currently estimated at $358,264, approximately $275 per square foot. 214 Conhocken Ct is a home located in Rutherford County with nearby schools including Rockvale Elementary School, Rockvale Middle School, and Rockvale High School.
Ownership History
Date
Name
Owned For
Owner Type
Purchase Details
Closed on
May 31, 2016
Sold by
Jenkins Jason Audrey
Bought by
Sorrell Daryl
Current Estimated Value
Home Financials for this Owner
Home Financials are based on the most recent Mortgage that was taken out on this home.
Original Mortgage
$183,870
Outstanding Balance
$145,338
Interest Rate
3.61%
Mortgage Type
VA
Estimated Equity
$212,926
Purchase Details
Closed on
Nov 5, 2008
Sold by
Olson Timothy K
Bought by
Jenkins Jason
Home Financials for this Owner
Home Financials are based on the most recent Mortgage that was taken out on this home.
Original Mortgage
$126,170
Interest Rate
5.89%
Mortgage Type
Purchase Money Mortgage
Purchase Details
Closed on
Aug 22, 2000
Sold by
Capozzi David M
Bought by
Olson Timothy K and Olson Melissa
Purchase Details
Closed on
Jul 16, 1996
Sold by
Rowland & Wilson Realty Co
Bought by
Capozzi David M
Create a Home Valuation Report for This Property
The Home Valuation Report is an in-depth analysis detailing your home's value as well as a comparison with similar homes in the area
Home Values in the Area
Average Home Value in this Area
Purchase History
| Date | Buyer | Sale Price | Title Company |
|---|---|---|---|
| Sorrell Daryl | $180,000 | -- | |
| Jenkins Jason | $134,200 | -- | |
| Olson Timothy K | $100,000 | -- | |
| Capozzi David M | $85,500 | -- |
Source: Public Records
Mortgage History
| Date | Status | Borrower | Loan Amount |
|---|---|---|---|
| Open | Sorrell Daryl | $183,870 | |
| Previous Owner | Capozzi David M | $126,170 |
Source: Public Records
Tax History
| Year | Tax Paid | Tax Assessment Tax Assessment Total Assessment is a certain percentage of the fair market value that is determined by local assessors to be the total taxable value of land and additions on the property. | Land | Improvement |
|---|---|---|---|---|
| 2025 | $1,208 | $64,400 | $13,750 | $50,650 |
| 2024 | $1,208 | $64,400 | $13,750 | $50,650 |
| 2023 | $1,208 | $64,400 | $13,750 | $50,650 |
| 2022 | $1,041 | $64,400 | $13,750 | $50,650 |
| 2021 | $974 | $43,900 | $9,250 | $34,650 |
| 2020 | $974 | $43,900 | $9,250 | $34,650 |
| 2019 | $974 | $43,900 | $9,250 | $34,650 |
| 2018 | $922 | $43,900 | $0 | $0 |
| 2017 | $809 | $30,200 | $0 | $0 |
| 2016 | $809 | $30,200 | $0 | $0 |
| 2015 | $809 | $30,200 | $0 | $0 |
| 2014 | $751 | $30,200 | $0 | $0 |
| 2013 | -- | $31,200 | $0 | $0 |
Source: Public Records
Map
Nearby Homes
- 412 Conhocken Ct
- 3511 Quaker Ct
- 3352 Alta Ln
- 3337 Alta Ln
- 219 Rockcastle Dr
- 1242 Mac Duff Dr
- 3404 Whitebud Ln
- 0 Roxburghe Ct
- 3411 Juneberry Way
- 1430 Amal Dr
- 3012 Roscommon Dr
- 0 Scottish Dr Unit 9
- 0 Scottish Dr
- 3050 Weybridge Dr
- 2905 Stonehedge Dr
- 3520 Boxelder Way
- 2729 Stonehedge Dr
- 4510 Ropha Ct
- 1521 Carrick Dr
- 510 Nightcap Ln
- 218 Conhocken Ct
- 210 Conhocken Ct
- 222 Conhocken Ct
- 206 Conhocken Ct
- 3735 Franklin Rd
- 223 Conhocken Ct
- 226 Conhocken Ct
- 202 Conhocken Ct
- 230 Conhocken Ct
- 209 Conhocken Ct
- 234 Conhocken Ct
- 3763 Franklin Rd
- 231 Conhocken Ct
- 238 Conhocken Ct
- 120 Pennsauken Ct
- 126 Pennsauken Ct
- 112 Pennsauken Ct
- 134 Pennsauken Ct
- 3737 Franklin Rd
- 303 Conhocken Ct
Your Personal Tour Guide
Ask me questions while you tour the home.