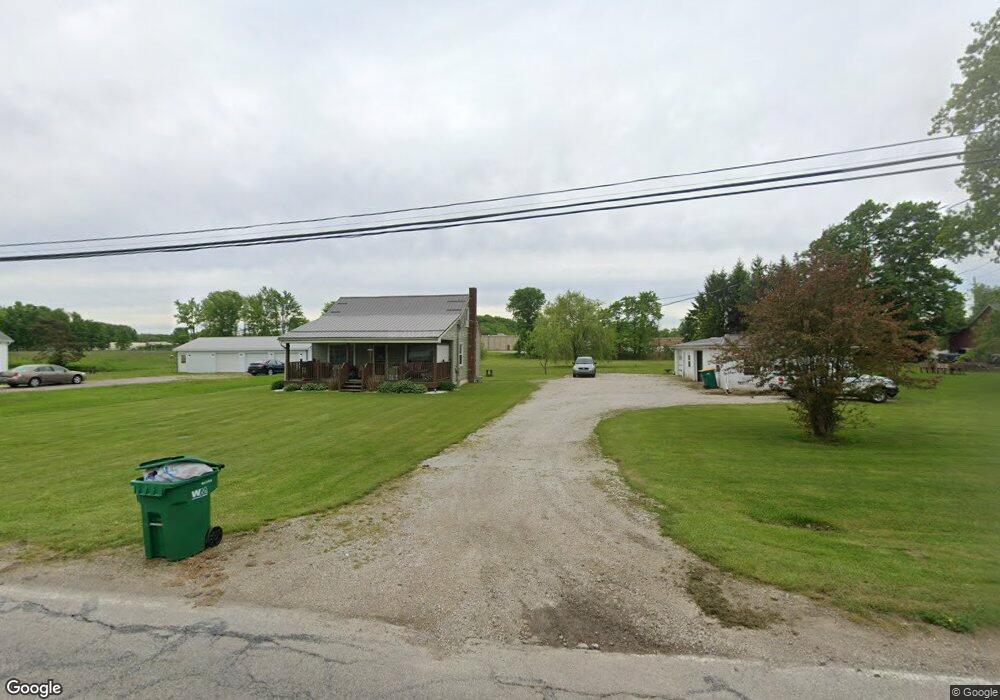
214 E Jefferson St Jefferson, OH 44047
Estimated Value: $127,708 - $156,000
2
Beds
1
Bath
720
Sq Ft
$199/Sq Ft
Est. Value
About This Home
This home is located at 214 E Jefferson St, Jefferson, OH 44047 and is currently estimated at $143,177, approximately $198 per square foot. 214 E Jefferson St is a home located in Ashtabula County with nearby schools including Jefferson Elementary School, Jefferson Area Junior High School, and Jefferson Area Senior High School.
Ownership History
Date
Name
Owned For
Owner Type
Purchase Details
Closed on
Nov 20, 2007
Sold by
Fink Larry L and Fink Ruth
Bought by
Crudele Eileen M
Current Estimated Value
Home Financials for this Owner
Home Financials are based on the most recent Mortgage that was taken out on this home.
Original Mortgage
$58,400
Outstanding Balance
$37,121
Interest Rate
6.47%
Mortgage Type
Unknown
Estimated Equity
$106,056
Purchase Details
Closed on
Jul 20, 2001
Sold by
Fink Danny
Bought by
Fink Larry L and Fink Ruth
Home Financials for this Owner
Home Financials are based on the most recent Mortgage that was taken out on this home.
Original Mortgage
$40,000
Interest Rate
7.22%
Mortgage Type
New Conventional
Purchase Details
Closed on
Nov 8, 1996
Sold by
Fink Gladys P
Bought by
Fink Danny and Fink Judy
Home Financials for this Owner
Home Financials are based on the most recent Mortgage that was taken out on this home.
Original Mortgage
$39,600
Interest Rate
7%
Mortgage Type
New Conventional
Create a Home Valuation Report for This Property
The Home Valuation Report is an in-depth analysis detailing your home's value as well as a comparison with similar homes in the area
Home Values in the Area
Average Home Value in this Area
Purchase History
| Date | Buyer | Sale Price | Title Company |
|---|---|---|---|
| Crudele Eileen M | $73,000 | Chicago Title | |
| Fink Larry L | $60,000 | -- | |
| Fink Danny | $39,600 | -- |
Source: Public Records
Mortgage History
| Date | Status | Borrower | Loan Amount |
|---|---|---|---|
| Open | Crudele Eileen M | $58,400 | |
| Previous Owner | Fink Larry L | $40,000 | |
| Previous Owner | Fink Danny | $39,600 |
Source: Public Records
Tax History
| Year | Tax Paid | Tax Assessment Tax Assessment Total Assessment is a certain percentage of the fair market value that is determined by local assessors to be the total taxable value of land and additions on the property. | Land | Improvement |
|---|---|---|---|---|
| 2024 | $3,001 | $34,480 | $10,290 | $24,190 |
| 2023 | $1,640 | $34,480 | $10,290 | $24,190 |
| 2022 | $1,314 | $25,170 | $7,910 | $17,260 |
| 2021 | $1,259 | $25,170 | $7,910 | $17,260 |
| 2020 | $1,262 | $25,170 | $7,910 | $17,260 |
| 2019 | $1,126 | $21,770 | $7,630 | $14,140 |
| 2018 | $1,094 | $21,770 | $7,630 | $14,140 |
| 2017 | $1,093 | $21,770 | $7,630 | $14,140 |
| 2016 | $1,110 | $21,600 | $7,560 | $14,040 |
| 2015 | $1,084 | $21,600 | $7,560 | $14,040 |
| 2014 | $1,058 | $21,600 | $7,560 | $14,040 |
| 2013 | $1,059 | $21,740 | $9,170 | $12,570 |
Source: Public Records
Map
Nearby Homes
- 68 E Ashtabula St
- 138 E Cedar St
- 309 Woodland Way Unit A
- 304 Woodland Way
- 2234 Ohio 307
- 800 Lenox New Lyme Rd
- 850 State Route 46 N
- 242 Jackson St
- 243 Jackson St
- 0 Vl St Rt 307
- 187 Garfield Ln
- 425 Woodside Ave
- 1749 Black Sea Rd
- 0000 Black Sea Rd
- 0 State Route 307 Unit 5168871
- 0 State Route 307 Unit LotWP001
- 1592 Brown Rd
- 2977 Ohio 307
- 876 Clay Rd
- 2631 State Route 46 N
- 226 E Jefferson St
- 0 E Jefferson St
- 227 E Jefferson St
- 205 E Jefferson St
- 232 E Jefferson St
- 197 E Jefferson St
- 234 E Jefferson St
- 196 E Jefferson St
- 20 S Sycamore St
- 183 E Jefferson St
- 245 E Jefferson St
- 24 N Sycamore St
- 181 E Jefferson St
- 190 E Jefferson St
- 19 N Sycamore St
- 36 N Sycamore St
- 179 E Jefferson St
- 29 N Sycamore St
- 259 E Jefferson St
- 168 E Jefferson St
Your Personal Tour Guide
Ask me questions while you tour the home.