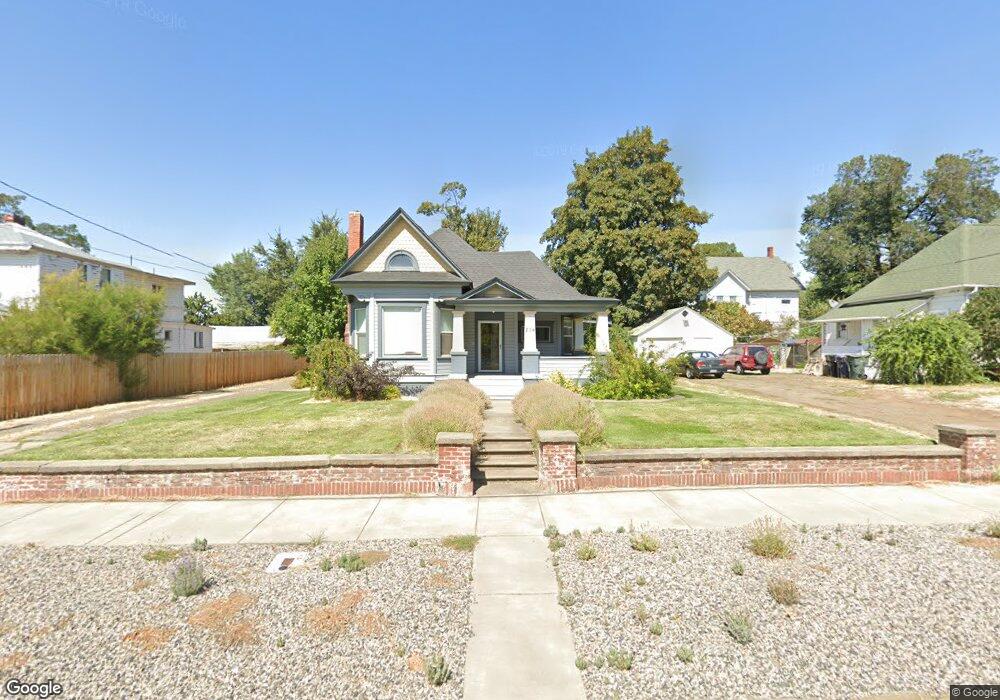
214 Eagan St Walla Walla, WA 99362
Estimated Value: $352,000 - $398,000
2
Beds
2
Baths
1,357
Sq Ft
$280/Sq Ft
Est. Value
About This Home
This home is located at 214 Eagan St, Walla Walla, WA 99362 and is currently estimated at $379,501, approximately $279 per square foot. 214 Eagan St is a home located in Walla Walla County with nearby schools including Sharpstein Elementary School and Garrison Middle School.
Ownership History
Date
Name
Owned For
Owner Type
Purchase Details
Closed on
Jun 4, 2016
Sold by
Siemssen Richard A and Siemssen Judith M
Bought by
Siemssen Richard M and Siemssen Judith A
Current Estimated Value
Purchase Details
Closed on
Nov 17, 2005
Sold by
Dennis Clifford G
Bought by
Siemssen Richard M and Siemssen Judith A
Home Financials for this Owner
Home Financials are based on the most recent Mortgage that was taken out on this home.
Original Mortgage
$121,200
Outstanding Balance
$64,769
Interest Rate
5.93%
Mortgage Type
New Conventional
Estimated Equity
$314,732
Create a Home Valuation Report for This Property
The Home Valuation Report is an in-depth analysis detailing your home's value as well as a comparison with similar homes in the area
Purchase History
| Date | Buyer | Sale Price | Title Company |
|---|---|---|---|
| Siemssen Richard M | -- | None Available | |
| Siemssen Richard M | $151,500 | Land Title Of Walla Walla Co |
Source: Public Records
Mortgage History
| Date | Status | Borrower | Loan Amount |
|---|---|---|---|
| Open | Siemssen Richard M | $121,200 |
Source: Public Records
Tax History
| Year | Tax Paid | Tax Assessment Tax Assessment Total Assessment is a certain percentage of the fair market value that is determined by local assessors to be the total taxable value of land and additions on the property. | Land | Improvement |
|---|---|---|---|---|
| 2025 | $4,110 | $415,070 | $78,920 | $336,150 |
| 2024 | $3,171 | $415,070 | $78,920 | $336,150 |
| 2023 | $3,171 | $358,060 | $53,620 | $304,440 |
| 2022 | $2,802 | $330,380 | $53,620 | $276,760 |
| 2021 | $2,526 | $258,630 | $53,620 | $205,010 |
| 2020 | $2,497 | $211,320 | $53,620 | $157,700 |
| 2019 | $2,203 | $211,320 | $53,620 | $157,700 |
| 2018 | $1,991 | $203,810 | $53,620 | $150,190 |
| 2017 | $1,734 | $150,790 | $50,800 | $99,990 |
| 2016 | $1,823 | $141,700 | $50,800 | $90,900 |
| 2015 | $1,784 | $141,700 | $50,800 | $90,900 |
| 2014 | -- | $141,700 | $50,800 | $90,900 |
| 2013 | -- | $141,700 | $50,800 | $90,900 |
Source: Public Records
Map
Nearby Homes
Your Personal Tour Guide
Ask me questions while you tour the home.