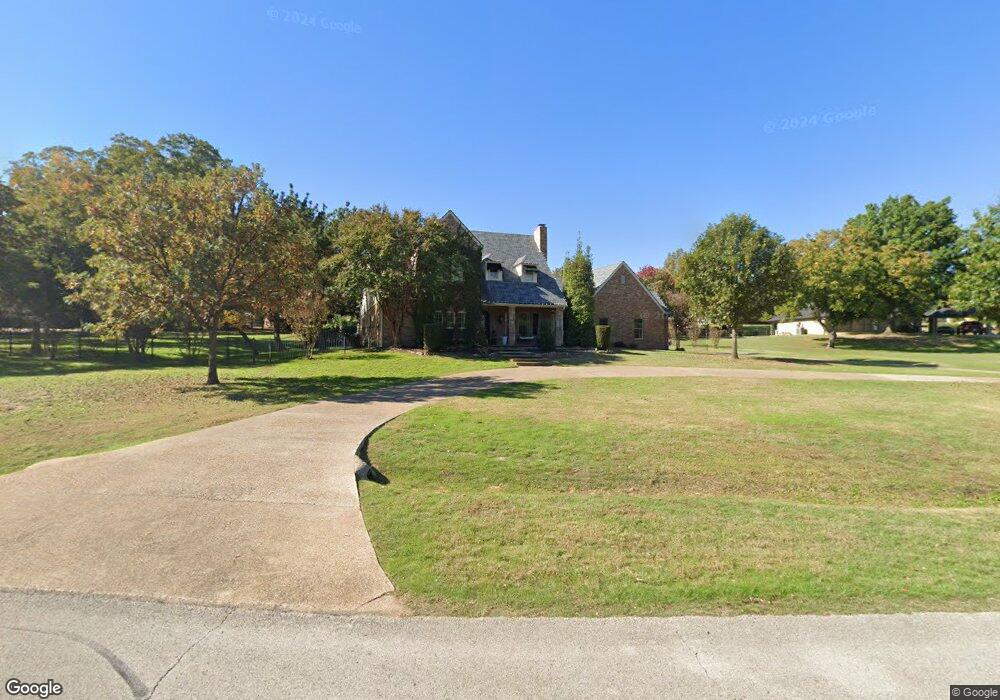
214 Eastwood Dr Southlake, TX 76092
Estimated Value: $1,275,000 - $1,733,000
4
Beds
3
Baths
4,221
Sq Ft
$343/Sq Ft
Est. Value
About This Home
This home is located at 214 Eastwood Dr, Southlake, TX 76092 and is currently estimated at $1,446,655, approximately $342 per square foot. 214 Eastwood Dr is a home located in Tarrant County with nearby schools including Old Union Elementary School, Eubanks Intermediate School, and George Dawson Middle School.
Ownership History
Date
Name
Owned For
Owner Type
Purchase Details
Closed on
Oct 26, 1999
Sold by
Weyer Bradley and Weyer Joanna
Bought by
Wilkerson Lance A and Wiman Kimberly V
Current Estimated Value
Home Financials for this Owner
Home Financials are based on the most recent Mortgage that was taken out on this home.
Original Mortgage
$187,200
Outstanding Balance
$57,587
Interest Rate
7.85%
Estimated Equity
$1,389,068
Purchase Details
Closed on
Aug 21, 1998
Sold by
Ashmore William Gary and Ashmore Gayle S
Bought by
Weyer Bradley and Weyer Joanna
Home Financials for this Owner
Home Financials are based on the most recent Mortgage that was taken out on this home.
Original Mortgage
$200,000
Interest Rate
6.9%
Create a Home Valuation Report for This Property
The Home Valuation Report is an in-depth analysis detailing your home's value as well as a comparison with similar homes in the area
Home Values in the Area
Average Home Value in this Area
Purchase History
| Date | Buyer | Sale Price | Title Company |
|---|---|---|---|
| Wilkerson Lance A | -- | American Title Co | |
| Weyer Bradley | -- | American Title Co |
Source: Public Records
Mortgage History
| Date | Status | Borrower | Loan Amount |
|---|---|---|---|
| Open | Wilkerson Lance A | $187,200 | |
| Previous Owner | Weyer Bradley | $200,000 |
Source: Public Records
Tax History Compared to Growth
Tax History
| Year | Tax Paid | Tax Assessment Tax Assessment Total Assessment is a certain percentage of the fair market value that is determined by local assessors to be the total taxable value of land and additions on the property. | Land | Improvement |
|---|---|---|---|---|
| 2025 | $10,470 | $953,997 | $624,600 | $329,397 |
| 2024 | $10,470 | $1,049,397 | $624,600 | $424,797 |
| 2023 | $11,745 | $1,028,821 | $624,600 | $404,221 |
| 2022 | $12,638 | $751,530 | $458,000 | $293,530 |
| 2021 | $12,142 | $752,905 | $458,000 | $294,905 |
| 2020 | $11,128 | $699,629 | $516,400 | $183,229 |
| 2019 | $10,657 | $727,344 | $516,400 | $210,944 |
| 2018 | $8,986 | $400,099 | $348,040 | $52,059 |
| 2017 | $9,015 | $676,164 | $316,400 | $359,764 |
| 2016 | $8,196 | $638,420 | $333,000 | $305,420 |
| 2015 | $7,176 | $300,600 | $50,000 | $250,600 |
| 2014 | $7,176 | $300,600 | $50,000 | $250,600 |
Source: Public Records
Map
Nearby Homes
- 223 Westwood Dr
- 1304 Kings Brook Ct
- 702 Sussex Ct
- 1591 Main St
- 1577 Main St
- 215 Park Ridge Blvd
- 231 Park Ridge Blvd
- 350 Central Ave Unit 202
- 350 Central Ave Unit 503
- 350 Central Ave Unit 201
- 350 Central Ave Unit 307
- 350 Central Ave Unit 310
- 450 Briarwood Dr
- 1401 Chardonnay Ct
- 1032 Rosavine Dr
- 1028 Rosavine Dr
- 1017 Rosavine Dr
- 1004 Rosavine Dr
- 1020 Rosavine Dr
- 1012 Rosavine Dr
- 217 Westwood Dr
- 212 Eastwood Dr
- 215 Eastwood Dr
- 213 Eastwood Dr
- 217 Eastwood Dr
- 219 Westwood Dr
- 211 Eastwood Dr
- 219 Eastwood Dr
- 209 Eastwood Dr
- 216 Westwood Dr
- 214 Westwood Dr
- 218 Eastwood Dr
- 211 Westwood Dr
- 221 Westwood Dr
- 221 Eastwood Dr
- 212 Westwood Dr
- 218 Westwood Dr
- 1318 Forest Hills Ct
- 1319 Forest Hills Ct
- 209 Westwood Dr