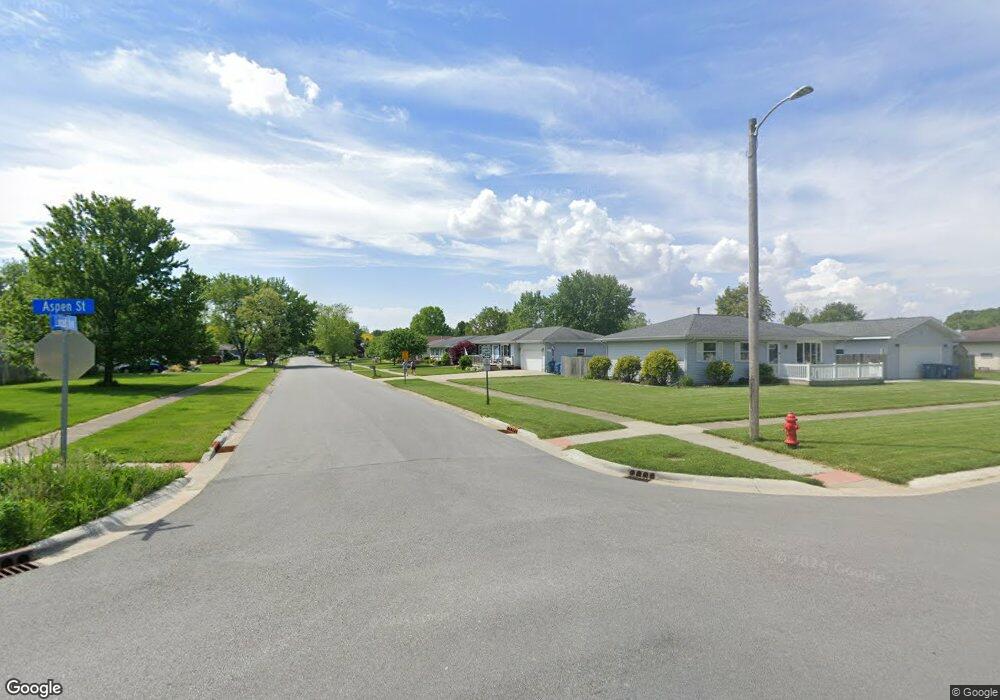
214 Locust Ave S Hebron, IN 46341
Porter County NeighborhoodEstimated Value: $242,000 - $256,987
3
Beds
1
Bath
1,120
Sq Ft
$224/Sq Ft
Est. Value
About This Home
This home is located at 214 Locust Ave S, Hebron, IN 46341 and is currently estimated at $250,497, approximately $223 per square foot. 214 Locust Ave S is a home located in Porter County with nearby schools including Hebron Elementary School, Hebron Middle School, and Hebron High School.
Ownership History
Date
Name
Owned For
Owner Type
Purchase Details
Closed on
Aug 18, 2006
Sold by
Herma Kathleen Lou
Bought by
Conaway David W
Current Estimated Value
Home Financials for this Owner
Home Financials are based on the most recent Mortgage that was taken out on this home.
Original Mortgage
$107,900
Outstanding Balance
$65,028
Interest Rate
6.83%
Mortgage Type
Purchase Money Mortgage
Estimated Equity
$185,470
Create a Home Valuation Report for This Property
The Home Valuation Report is an in-depth analysis detailing your home's value as well as a comparison with similar homes in the area
Home Values in the Area
Average Home Value in this Area
Purchase History
| Date | Buyer | Sale Price | Title Company |
|---|---|---|---|
| Conaway David W | -- | Chicago Title Insurance Co |
Source: Public Records
Mortgage History
| Date | Status | Borrower | Loan Amount |
|---|---|---|---|
| Open | Conaway David W | $107,900 |
Source: Public Records
Tax History
| Year | Tax Paid | Tax Assessment Tax Assessment Total Assessment is a certain percentage of the fair market value that is determined by local assessors to be the total taxable value of land and additions on the property. | Land | Improvement |
|---|---|---|---|---|
| 2024 | $2,388 | $222,700 | $33,400 | $189,300 |
| 2023 | $2,361 | $213,200 | $31,400 | $181,800 |
| 2022 | $2,192 | $200,100 | $31,400 | $168,700 |
| 2021 | $1,798 | $163,500 | $31,400 | $132,100 |
| 2020 | $1,685 | $154,000 | $28,600 | $125,400 |
| 2019 | $1,610 | $147,500 | $28,600 | $118,900 |
| 2018 | $1,603 | $141,800 | $28,600 | $113,200 |
| 2017 | $1,520 | $134,900 | $28,600 | $106,300 |
| 2016 | $1,571 | $139,100 | $27,900 | $111,200 |
| 2014 | $1,447 | $128,700 | $28,100 | $100,600 |
| 2013 | -- | $121,100 | $28,200 | $92,900 |
Source: Public Records
Map
Nearby Homes
- 212 Locust Ave S
- 216 Locust Ave S
- 217 Locust Ave S
- 215 Locust Ave S
- 210 Locust Ave S
- 111 Orange Ct
- 802 Aspen St
- 109 Orange Ct
- 213 Locust Ave S
- 113 Orange Ct
- 107 Orange Ct
- 706 Aspen St
- 806 Aspen St
- 211 Locust Ave S
- 105 Orange Ct
- 209 Locust Ave S
- 206 Locust Ave S
- 702 Aspen St
- 103 Orange Ct
- 110 Orange Ct
Your Personal Tour Guide
Ask me questions while you tour the home.