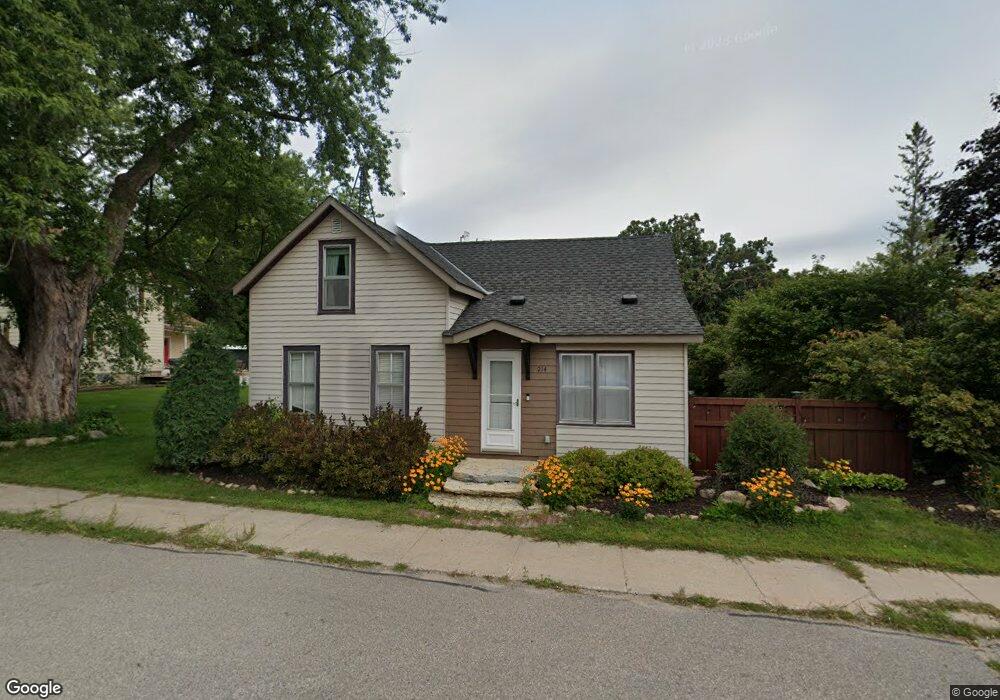
214 Main St Nerstrand, MN 55053
Estimated Value: $197,000 - $346,000
3
Beds
1
Bath
1,385
Sq Ft
$184/Sq Ft
Est. Value
About This Home
This home is located at 214 Main St, Nerstrand, MN 55053 and is currently estimated at $254,768, approximately $183 per square foot. 214 Main St is a home located in Rice County with nearby schools including Roosevelt Elementary School, Faribault Middle School, and Faribault Senior High School.
Ownership History
Date
Name
Owned For
Owner Type
Purchase Details
Closed on
Jul 1, 2015
Sold by
Feldman Jonathan Jonathan
Bought by
Jerome Christina Christina
Current Estimated Value
Home Financials for this Owner
Home Financials are based on the most recent Mortgage that was taken out on this home.
Original Mortgage
$113,800
Outstanding Balance
$89,228
Interest Rate
4.02%
Estimated Equity
$165,540
Purchase Details
Closed on
Sep 4, 2003
Sold by
Evavold Todd A and Evavold Annette R
Bought by
Feldman Jonathan
Create a Home Valuation Report for This Property
The Home Valuation Report is an in-depth analysis detailing your home's value as well as a comparison with similar homes in the area
Purchase History
| Date | Buyer | Sale Price | Title Company |
|---|---|---|---|
| Jerome Christina Christina | $124,500 | -- | |
| Feldman Jonathan | $124,000 | -- |
Source: Public Records
Mortgage History
| Date | Status | Borrower | Loan Amount |
|---|---|---|---|
| Open | Jerome Christina Christina | $113,800 |
Source: Public Records
Tax History
| Year | Tax Paid | Tax Assessment Tax Assessment Total Assessment is a certain percentage of the fair market value that is determined by local assessors to be the total taxable value of land and additions on the property. | Land | Improvement |
|---|---|---|---|---|
| 2025 | $1,764 | $203,100 | $36,800 | $166,300 |
| 2024 | $1,764 | $166,800 | $30,600 | $136,200 |
| 2023 | $1,626 | $166,800 | $30,600 | $136,200 |
| 2022 | $1,478 | $150,000 | $28,200 | $121,800 |
| 2021 | $1,434 | $133,600 | $24,500 | $109,100 |
| 2020 | $1,328 | $131,300 | $24,500 | $106,800 |
| 2019 | $1,158 | $125,100 | $24,500 | $100,600 |
| 2018 | $1,134 | $113,900 | $24,500 | $89,400 |
| 2017 | $1,124 | $110,000 | $24,500 | $85,500 |
| 2016 | $752 | $107,800 | $24,500 | $83,300 |
| 2015 | $1,050 | $79,900 | $23,300 | $56,600 |
| 2014 | -- | $85,400 | $23,300 | $62,100 |
Source: Public Records
Map
Nearby Homes
Your Personal Tour Guide
Ask me questions while you tour the home.