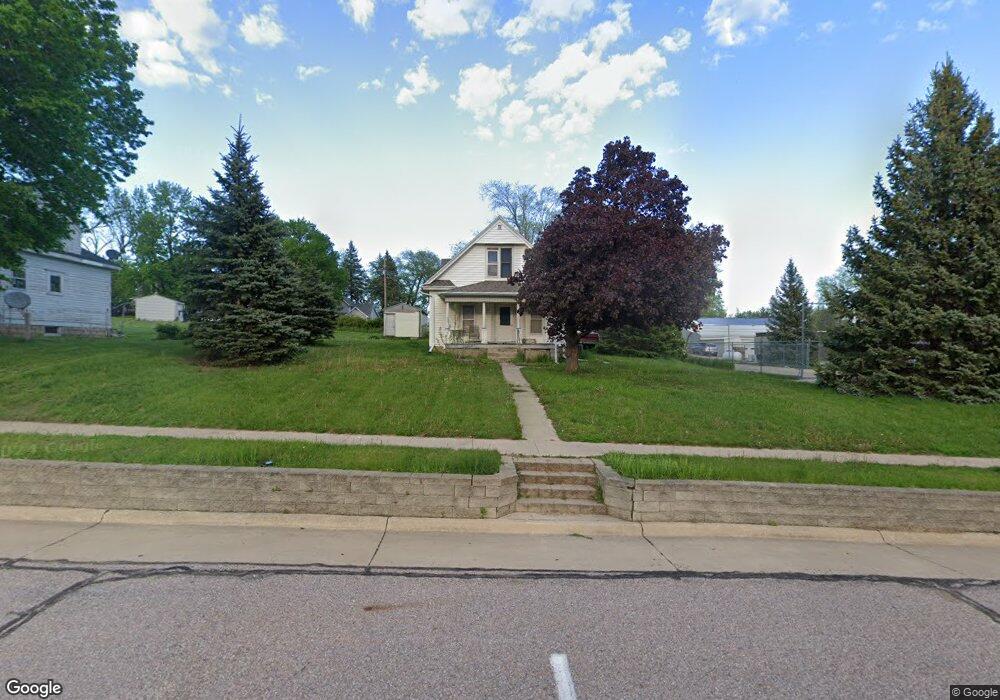
214 Main St Pierson, IA 51048
Estimated Value: $59,000 - $111,000
3
Beds
1
Bath
672
Sq Ft
$115/Sq Ft
Est. Value
About This Home
This home is located at 214 Main St, Pierson, IA 51048 and is currently estimated at $77,333, approximately $115 per square foot. 214 Main St is a home with nearby schools including Pierson Elementary School, Pierson Middle School, and Kingsley-Pierson High School.
Ownership History
Date
Name
Owned For
Owner Type
Purchase Details
Closed on
Jul 11, 2016
Sold by
Mobley Harold Rex
Bought by
Vitito Denton J
Current Estimated Value
Purchase Details
Closed on
Apr 22, 2016
Sold by
Mobley Harold R
Bought by
Mobley Harold Rex
Purchase Details
Closed on
Mar 16, 2006
Sold by
Us Bank Na
Bought by
Mobley Harold R
Home Financials for this Owner
Home Financials are based on the most recent Mortgage that was taken out on this home.
Original Mortgage
$12,255
Interest Rate
6.87%
Mortgage Type
Adjustable Rate Mortgage/ARM
Create a Home Valuation Report for This Property
The Home Valuation Report is an in-depth analysis detailing your home's value as well as a comparison with similar homes in the area
Home Values in the Area
Average Home Value in this Area
Purchase History
| Date | Buyer | Sale Price | Title Company |
|---|---|---|---|
| Vitito Denton J | -- | None Listed On Document | |
| Mobley Harold Rex | -- | Attorney | |
| Mobley Harold R | $13,000 | -- |
Source: Public Records
Mortgage History
| Date | Status | Borrower | Loan Amount |
|---|---|---|---|
| Previous Owner | Mobley Harold R | $12,255 |
Source: Public Records
Tax History Compared to Growth
Tax History
| Year | Tax Paid | Tax Assessment Tax Assessment Total Assessment is a certain percentage of the fair market value that is determined by local assessors to be the total taxable value of land and additions on the property. | Land | Improvement |
|---|---|---|---|---|
| 2025 | $596 | $42,360 | $4,460 | $37,900 |
| 2024 | $596 | $43,820 | $4,460 | $39,360 |
| 2023 | $490 | $43,820 | $4,460 | $39,360 |
| 2022 | $480 | $32,020 | $4,460 | $27,560 |
| 2021 | $480 | $32,020 | $4,460 | $27,560 |
| 2020 | $450 | $29,820 | $4,770 | $25,050 |
| 2019 | $430 | $29,820 | $4,770 | $25,050 |
| 2018 | $440 | $28,030 | $4,770 | $23,260 |
| 2017 | $440 | $28,030 | $4,770 | $23,260 |
| 2016 | $444 | $28,030 | $0 | $0 |
| 2015 | $613 | $26,200 | $4,460 | $21,740 |
| 2014 | $599 | $26,330 | $4,460 | $21,870 |
Source: Public Records
Map
Nearby Homes