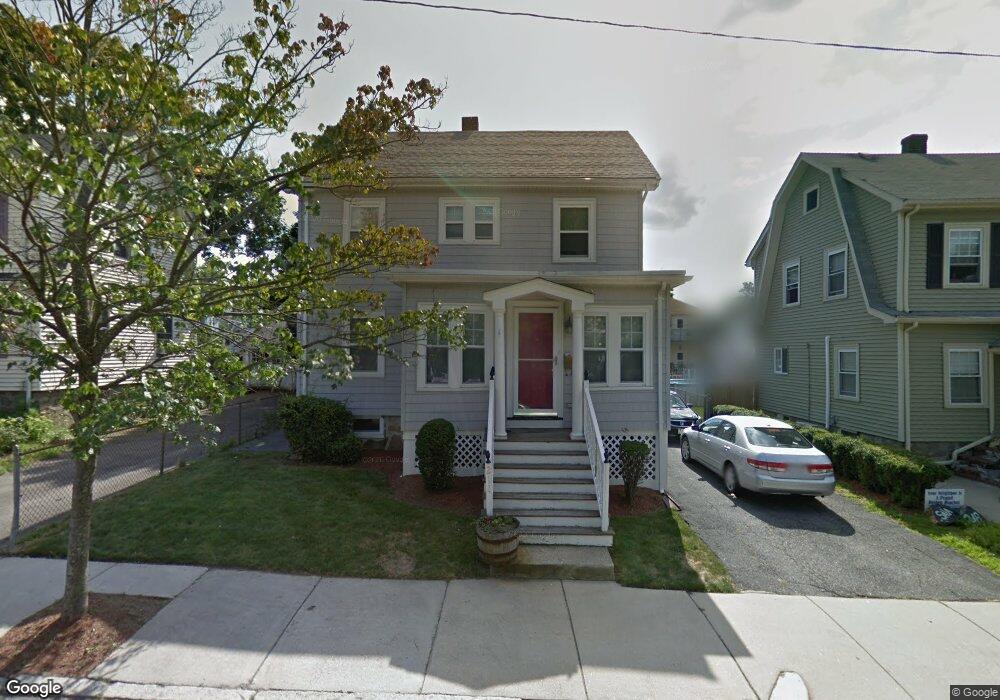
214 Maple St West Roxbury, MA 02132
West Roxbury NeighborhoodEstimated Value: $752,932 - $892,000
3
Beds
1
Bath
1,411
Sq Ft
$589/Sq Ft
Est. Value
About This Home
This home is located at 214 Maple St, West Roxbury, MA 02132 and is currently estimated at $830,983, approximately $588 per square foot. 214 Maple St is a home located in Suffolk County with nearby schools including Holy Name Parish School, St Theresa School, and The Roxbury Latin School.
Ownership History
Date
Name
Owned For
Owner Type
Purchase Details
Closed on
Oct 31, 2000
Sold by
Curley Derek J and Curley Catherine A
Bought by
Perry Michael and Folet Perry Mary Y
Current Estimated Value
Home Financials for this Owner
Home Financials are based on the most recent Mortgage that was taken out on this home.
Original Mortgage
$189,000
Interest Rate
7.83%
Mortgage Type
Purchase Money Mortgage
Purchase Details
Closed on
Oct 30, 1998
Sold by
Mcnichols Elizabeth A and Mcnichols Richard G
Bought by
Curley Derek and Harris Catherine A
Purchase Details
Closed on
Jun 1, 1993
Sold by
Newman Alexander and Newman Margarita
Bought by
Sousa Elizabeth and Mcnichols Richard G
Create a Home Valuation Report for This Property
The Home Valuation Report is an in-depth analysis detailing your home's value as well as a comparison with similar homes in the area
Home Values in the Area
Average Home Value in this Area
Purchase History
| Date | Buyer | Sale Price | Title Company |
|---|---|---|---|
| Perry Michael | $259,000 | -- | |
| Curley Derek | $185,000 | -- | |
| Sousa Elizabeth | $144,500 | -- |
Source: Public Records
Mortgage History
| Date | Status | Borrower | Loan Amount |
|---|---|---|---|
| Open | Sousa Elizabeth | $50,000 | |
| Open | Sousa Elizabeth | $190,000 | |
| Closed | Sousa Elizabeth | $189,000 |
Source: Public Records
Tax History Compared to Growth
Tax History
| Year | Tax Paid | Tax Assessment Tax Assessment Total Assessment is a certain percentage of the fair market value that is determined by local assessors to be the total taxable value of land and additions on the property. | Land | Improvement |
|---|---|---|---|---|
| 2025 | $7,892 | $681,500 | $240,800 | $440,700 |
| 2024 | $6,729 | $617,300 | $230,800 | $386,500 |
| 2023 | $6,254 | $582,300 | $217,700 | $364,600 |
| 2022 | $5,759 | $529,300 | $197,900 | $331,400 |
| 2021 | $5,255 | $492,500 | $190,300 | $302,200 |
| 2020 | $5,149 | $487,600 | $171,300 | $316,300 |
| 2019 | $4,786 | $454,100 | $149,200 | $304,900 |
| 2018 | $4,578 | $436,800 | $149,200 | $287,600 |
| 2017 | $4,578 | $432,300 | $149,200 | $283,100 |
| 2016 | $4,444 | $404,000 | $149,200 | $254,800 |
| 2015 | $4,590 | $379,000 | $162,800 | $216,200 |
| 2014 | $4,499 | $357,600 | $162,800 | $194,800 |
Source: Public Records
Map
Nearby Homes
- 168 Maple St
- 701 Vfw Pkwy
- 104 Greaton Rd
- 89 Dwinell St
- 37 Hastings St Unit 103
- 10 Burwell Rd
- 76 Potomac St
- 845 Lagrange St Unit 4
- 110 Park St Unit 3
- 539 Lagrange St
- 139 Newfield St
- 931 Lagrange St
- 23 Westgate Rd Unit 6
- 331 Vermont St
- 416 Belgrade Ave Unit 25
- 73 Dent St Unit 1
- 577 Baker St Unit 577
- 72 Wallis Rd
- 173 South St
- 42 Bryon Rd Unit 6