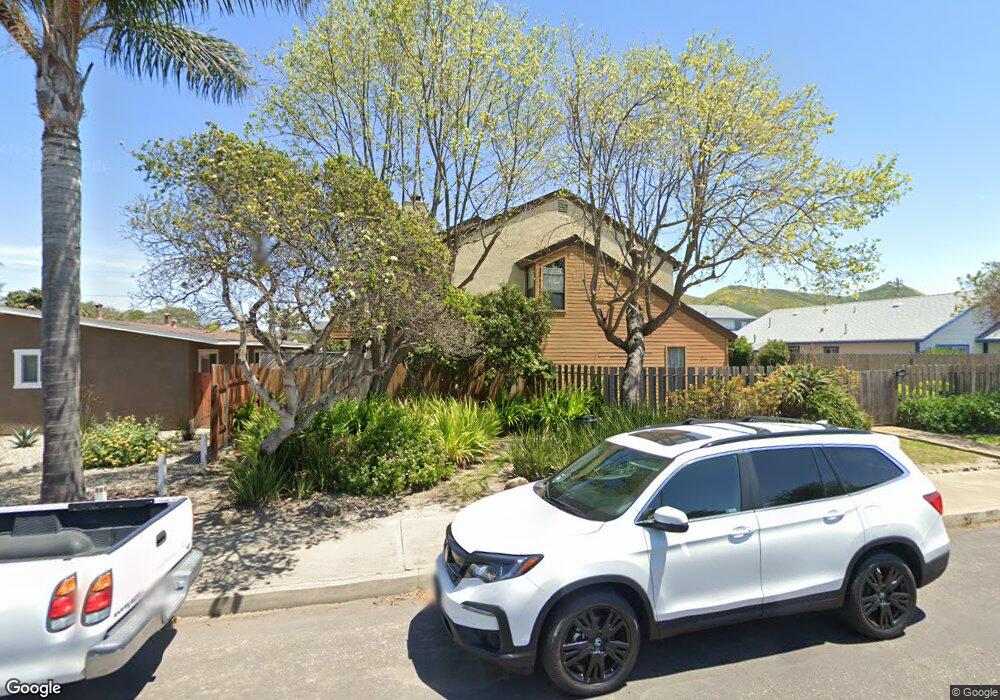
214 S F St Unit 1 Lompoc, CA 93436
Estimated Value: $328,487 - $381,000
2
Beds
2
Baths
946
Sq Ft
$370/Sq Ft
Est. Value
About This Home
This home is located at 214 S F St Unit 1, Lompoc, CA 93436 and is currently estimated at $350,372, approximately $370 per square foot. 214 S F St Unit 1 is a home located in Santa Barbara County with nearby schools including Arthur Hapgood Elementary School, Lompoc Valley Middle School, and Lompoc High School.
Ownership History
Date
Name
Owned For
Owner Type
Purchase Details
Closed on
Aug 1, 2006
Sold by
Pioch Yvonne M
Bought by
Flores Ofelio and Flores Maria Salud
Current Estimated Value
Home Financials for this Owner
Home Financials are based on the most recent Mortgage that was taken out on this home.
Original Mortgage
$228,000
Outstanding Balance
$136,888
Interest Rate
6.76%
Mortgage Type
New Conventional
Estimated Equity
$213,484
Purchase Details
Closed on
May 15, 1996
Sold by
Matter James Guerra and Matter Patricia
Bought by
Careyette Albert
Home Financials for this Owner
Home Financials are based on the most recent Mortgage that was taken out on this home.
Original Mortgage
$73,150
Interest Rate
7.96%
Purchase Details
Closed on
May 4, 1994
Sold by
Matter James Guerra
Bought by
Matter James Guerra and Matter Patricia Susan
Create a Home Valuation Report for This Property
The Home Valuation Report is an in-depth analysis detailing your home's value as well as a comparison with similar homes in the area
Home Values in the Area
Average Home Value in this Area
Purchase History
| Date | Buyer | Sale Price | Title Company |
|---|---|---|---|
| Flores Ofelio | $285,000 | United Independent Title Ins | |
| Careyette Albert | $77,000 | Chicago Title Co | |
| Matter James Guerra | -- | -- |
Source: Public Records
Mortgage History
| Date | Status | Borrower | Loan Amount |
|---|---|---|---|
| Open | Flores Ofelio | $228,000 | |
| Previous Owner | Careyette Albert | $73,150 |
Source: Public Records
Tax History Compared to Growth
Tax History
| Year | Tax Paid | Tax Assessment Tax Assessment Total Assessment is a certain percentage of the fair market value that is determined by local assessors to be the total taxable value of land and additions on the property. | Land | Improvement |
|---|---|---|---|---|
| 2025 | $2,255 | $212,000 | $77,000 | $135,000 |
| 2023 | $2,255 | $183,000 | $66,000 | $117,000 |
| 2022 | $2,056 | $180,000 | $65,000 | $115,000 |
| 2021 | $1,771 | $150,000 | $54,000 | $96,000 |
| 2020 | $1,655 | $140,000 | $50,000 | $90,000 |
| 2019 | $1,659 | $140,000 | $50,000 | $90,000 |
| 2018 | $1,584 | $133,000 | $47,000 | $86,000 |
| 2017 | $1,515 | $127,000 | $45,000 | $82,000 |
| 2016 | $1,317 | $110,000 | $39,000 | $71,000 |
| 2015 | $1,209 | $100,000 | $35,000 | $65,000 |
| 2014 | $1,156 | $95,000 | $33,000 | $62,000 |
Source: Public Records
Map
Nearby Homes