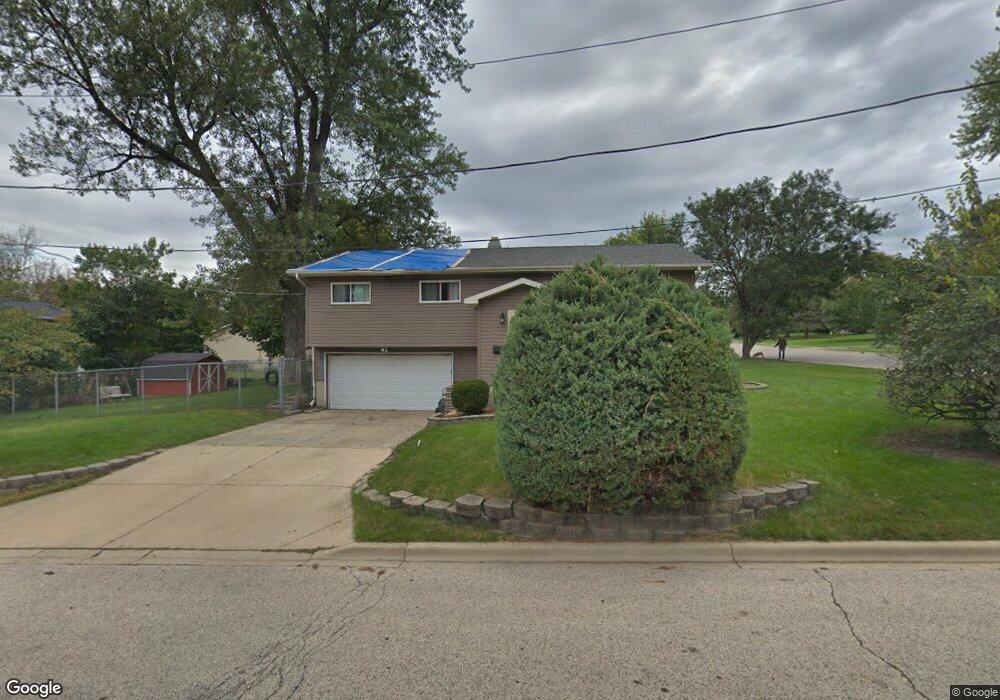
214 S Hubbard St Algonquin, IL 60102
Estimated Value: $273,886 - $343,000
--
Bed
1
Bath
1,320
Sq Ft
$238/Sq Ft
Est. Value
About This Home
This home is located at 214 S Hubbard St, Algonquin, IL 60102 and is currently estimated at $314,222, approximately $238 per square foot. 214 S Hubbard St is a home located in McHenry County with nearby schools including Eastview Elementary School, Algonquin Middle School, and Dundee-Crown High School.
Ownership History
Date
Name
Owned For
Owner Type
Purchase Details
Closed on
Dec 6, 2000
Sold by
Federal Home Loan Mortgage Corporation
Bought by
Mcelroy David T and Mcelroy Irma
Current Estimated Value
Home Financials for this Owner
Home Financials are based on the most recent Mortgage that was taken out on this home.
Original Mortgage
$131,100
Interest Rate
7.8%
Purchase Details
Closed on
Jan 31, 2000
Sold by
Winters
Bought by
Federal Home Loan Mortgage Corporation
Purchase Details
Closed on
Jul 8, 1996
Sold by
Jader Darrell L and Jader Donna J
Bought by
Wintes Thomas and Winters Elizabeth
Home Financials for this Owner
Home Financials are based on the most recent Mortgage that was taken out on this home.
Original Mortgage
$129,200
Interest Rate
8.07%
Create a Home Valuation Report for This Property
The Home Valuation Report is an in-depth analysis detailing your home's value as well as a comparison with similar homes in the area
Home Values in the Area
Average Home Value in this Area
Purchase History
| Date | Buyer | Sale Price | Title Company |
|---|---|---|---|
| Mcelroy David T | -- | -- | |
| Federal Home Loan Mortgage Corporation | -- | -- | |
| Wintes Thomas | $136,000 | Chicago Title |
Source: Public Records
Mortgage History
| Date | Status | Borrower | Loan Amount |
|---|---|---|---|
| Closed | Mcelroy David T | $131,100 | |
| Previous Owner | Wintes Thomas | $129,200 |
Source: Public Records
Tax History Compared to Growth
Tax History
| Year | Tax Paid | Tax Assessment Tax Assessment Total Assessment is a certain percentage of the fair market value that is determined by local assessors to be the total taxable value of land and additions on the property. | Land | Improvement |
|---|---|---|---|---|
| 2024 | $5,641 | $80,117 | $10,766 | $69,351 |
| 2023 | $5,329 | $71,655 | $9,629 | $62,026 |
| 2022 | $5,926 | $75,095 | $15,770 | $59,325 |
| 2021 | $5,675 | $69,960 | $14,692 | $55,268 |
| 2020 | $5,521 | $67,483 | $14,172 | $53,311 |
| 2019 | $5,380 | $64,589 | $13,564 | $51,025 |
| 2018 | $5,115 | $59,666 | $12,530 | $47,136 |
| 2017 | $5,000 | $56,209 | $11,804 | $44,405 |
| 2016 | $4,913 | $52,719 | $11,071 | $41,648 |
| 2013 | -- | $57,238 | $10,328 | $46,910 |
Source: Public Records
Map
Nearby Homes
- 0 River Dr N Unit MRD12473279
- 102 Center St
- 600 E Algonquin Rd
- 314 Washington St
- 420 N Harrison St
- 2 Sunset Ln
- 1188 E Algonquin Rd
- 911 Old Oak Cir Unit 1
- 903 Old Oak Cir
- 920 Plymouth Ct
- 925 N River Rd
- 69 Alice St
- 620 Old Oak Cir
- 0 Natoma Trail
- 721 Brentwood Ct
- 1245 Winaki Trail
- 1659 E Algonquin Rd
- 1114 Riverwood Dr Unit 1114
- lot 25 Wabican Trail
- 1561 Cumberland Pkwy