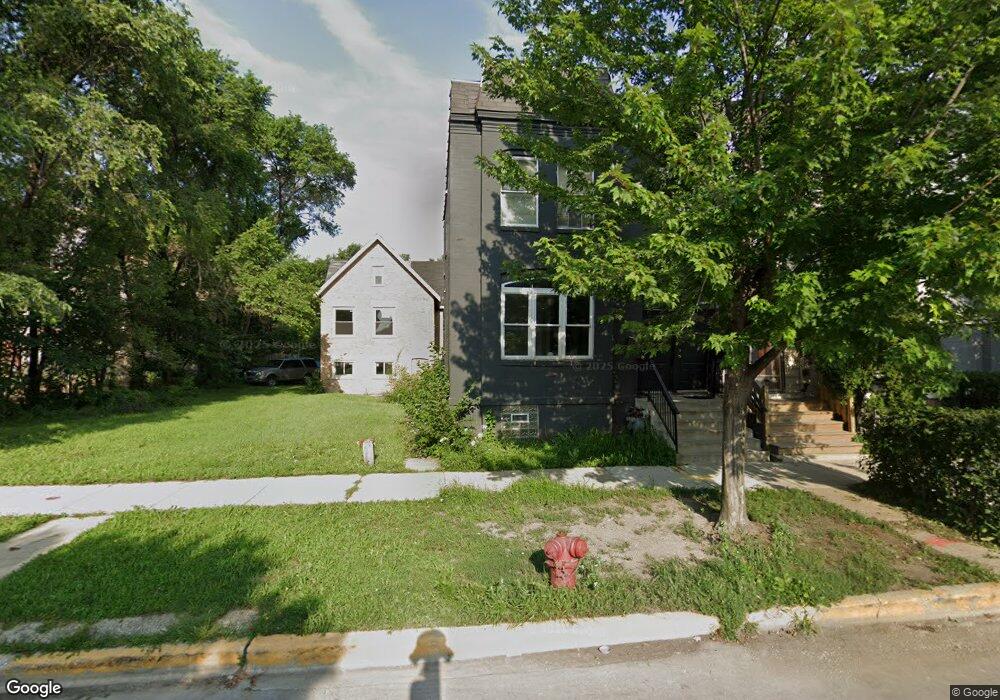
214 S Troy St Chicago, IL 60612
Garfield Park NeighborhoodEstimated Value: $298,000 - $458,000
4
Beds
2
Baths
1,470
Sq Ft
$258/Sq Ft
Est. Value
About This Home
This home is located at 214 S Troy St, Chicago, IL 60612 and is currently estimated at $379,243, approximately $257 per square foot. 214 S Troy St is a home located in Cook County with nearby schools including Cather Elementary School, Marshall Metropolitan High School, and A. Locke Charter Elementary Academy.
Ownership History
Date
Name
Owned For
Owner Type
Purchase Details
Closed on
Aug 6, 2018
Sold by
Kupczyk Robert
Bought by
Mr Mc Llc 214 S Troy
Current Estimated Value
Purchase Details
Closed on
Aug 18, 2017
Sold by
Gaston Carolyn
Bought by
Kupczyk Robert
Purchase Details
Closed on
Aug 27, 2008
Sold by
U S Bank Na
Bought by
Gaston Carolyn
Home Financials for this Owner
Home Financials are based on the most recent Mortgage that was taken out on this home.
Original Mortgage
$270,751
Interest Rate
5.09%
Mortgage Type
FHA
Purchase Details
Closed on
Nov 20, 2007
Sold by
Baginski Benedykt
Bought by
Us Bank and Trust #8273
Purchase Details
Closed on
Dec 16, 2003
Sold by
West Section Club
Bought by
Cosmopolitan Bank & Trust and Trust #31788
Home Financials for this Owner
Home Financials are based on the most recent Mortgage that was taken out on this home.
Original Mortgage
$140,000
Interest Rate
6.5%
Mortgage Type
Unknown
Create a Home Valuation Report for This Property
The Home Valuation Report is an in-depth analysis detailing your home's value as well as a comparison with similar homes in the area
Home Values in the Area
Average Home Value in this Area
Purchase History
| Date | Buyer | Sale Price | Title Company |
|---|---|---|---|
| Mr Mc Llc 214 S Troy | -- | Fidelity National Title | |
| Kupczyk Robert | $56,000 | Fidelity National Title | |
| Gaston Carolyn | $275,000 | First Equity Title Inc | |
| Us Bank | $95,500 | None Available | |
| Cosmopolitan Bank & Trust | $75,000 | Pntn |
Source: Public Records
Mortgage History
| Date | Status | Borrower | Loan Amount |
|---|---|---|---|
| Previous Owner | Gaston Carolyn | $270,751 | |
| Previous Owner | Cosmopolitan Bank & Trust | $140,000 |
Source: Public Records
Tax History Compared to Growth
Tax History
| Year | Tax Paid | Tax Assessment Tax Assessment Total Assessment is a certain percentage of the fair market value that is determined by local assessors to be the total taxable value of land and additions on the property. | Land | Improvement |
|---|---|---|---|---|
| 2024 | $3,599 | $23,001 | $3,988 | $19,013 |
| 2023 | $3,508 | $17,000 | $3,231 | $13,769 |
| 2022 | $3,508 | $17,000 | $3,231 | $13,769 |
| 2021 | $3,430 | $16,999 | $3,231 | $13,768 |
| 2020 | $2,575 | $11,521 | $3,231 | $8,290 |
| 2019 | $2,581 | $12,802 | $3,231 | $9,571 |
| 2018 | $2,537 | $12,802 | $3,231 | $9,571 |
| 2017 | $2,079 | $12,999 | $2,887 | $10,112 |
| 2016 | $2,103 | $12,999 | $2,887 | $10,112 |
| 2015 | $1,901 | $12,999 | $2,887 | $10,112 |
| 2014 | $1,746 | $11,977 | $2,750 | $9,227 |
| 2013 | $1,700 | $11,977 | $2,750 | $9,227 |
Source: Public Records
Map
Nearby Homes
- 209 S Albany Ave
- 3031 W 5th Ave
- 3153 W Madison St
- 3159 W Madison St
- 328 S Spaulding Ave
- 2947 W Wilcox St
- 2948 W Wilcox St
- 3320 W Monroe St
- 2933 W Wilcox St
- 3235 W Warren Blvd Unit 2
- 321 S Richmond St
- 325 S Richmond St
- 3334 W Warren Blvd
- 1106 S Sacramento Blvd
- 3328 W Warren Blvd
- 2904 W Madison St
- 2906 W Madison St
- 3020 W Washington Blvd
- 3018 W Flournoy St
- 3254 W Flournoy St Unit 1
- 216 S Troy St
- 212 S Troy St
- 210 S Troy St
- 210 S Troy St
- 208 S Troy St
- 208 S Troy St
- 206 S Troy St
- 3144 W Jackson Blvd
- 3144 W Jackson Blvd
- 219 S Troy St Unit C
- 219 S Troy St Unit D
- 219 S Troy St Unit B
- 219 S Troy St Unit A
- 219 S Troy St Unit 1R
- 207 S Troy St
- 3122 W Jackson Blvd
- 3122 W Jackson Blvd
- 3156 W Jackson Blvd
- 3154 W Jackson Blvd Unit 3
- 3154 W Jackson Blvd Unit 1