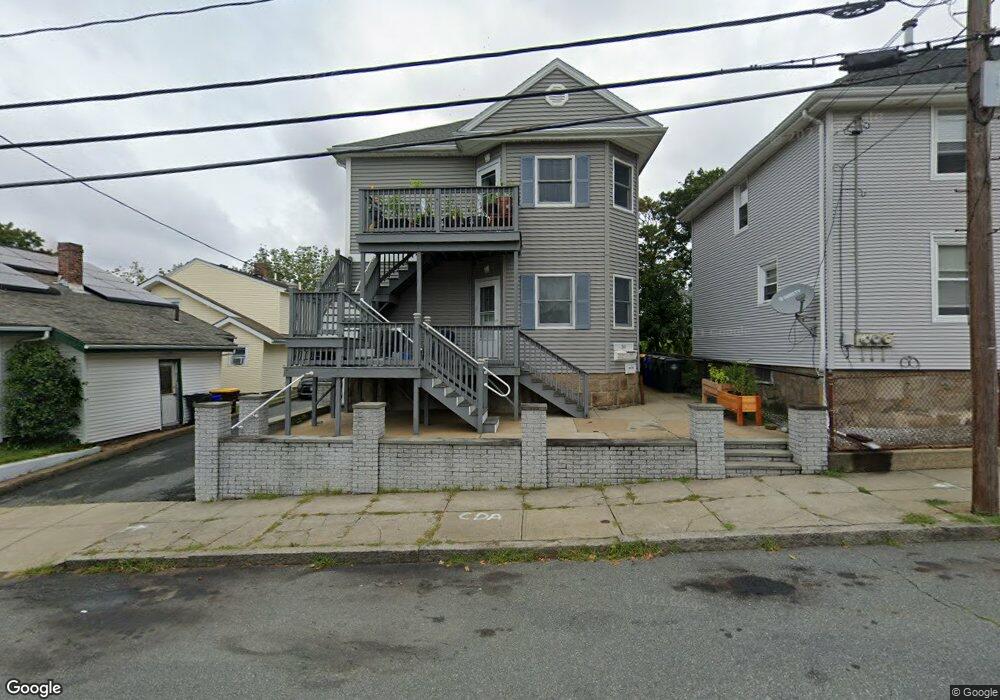
214 Slade St Unit 2nd Fall River, MA 02724
Sandy Beach NeighborhoodEstimated Value: $477,424 - $552,000
3
Beds
1
Bath
1,000
Sq Ft
$512/Sq Ft
Est. Value
About This Home
This home is located at 214 Slade St Unit 2nd, Fall River, MA 02724 and is currently estimated at $511,606, approximately $511 per square foot. 214 Slade St Unit 2nd is a home located in Bristol County with nearby schools including Carlton M. Viveiros Elementary School, Matthew J. Kuss Middle School, and B M C Durfee High School.
Ownership History
Date
Name
Owned For
Owner Type
Purchase Details
Closed on
Oct 10, 2003
Sold by
Javery Stephanie
Bought by
Ahaesy Douglas J and Ahaesy Erica M
Current Estimated Value
Home Financials for this Owner
Home Financials are based on the most recent Mortgage that was taken out on this home.
Original Mortgage
$144,000
Interest Rate
6.35%
Mortgage Type
Purchase Money Mortgage
Purchase Details
Closed on
Aug 4, 2003
Sold by
Javery John and Javery Stephanie
Bought by
Javery Stephanie
Create a Home Valuation Report for This Property
The Home Valuation Report is an in-depth analysis detailing your home's value as well as a comparison with similar homes in the area
Home Values in the Area
Average Home Value in this Area
Purchase History
| Date | Buyer | Sale Price | Title Company |
|---|---|---|---|
| Ahaesy Douglas J | $148,500 | -- | |
| Javery Stephanie | -- | -- |
Source: Public Records
Mortgage History
| Date | Status | Borrower | Loan Amount |
|---|---|---|---|
| Open | Javery Stephanie | $259,570 | |
| Closed | Javery Stephanie | $70,000 | |
| Closed | Javery Stephanie | $144,000 | |
| Previous Owner | Javery Stephanie | $104,500 |
Source: Public Records
Tax History Compared to Growth
Tax History
| Year | Tax Paid | Tax Assessment Tax Assessment Total Assessment is a certain percentage of the fair market value that is determined by local assessors to be the total taxable value of land and additions on the property. | Land | Improvement |
|---|---|---|---|---|
| 2025 | $5,011 | $437,600 | $130,600 | $307,000 |
| 2024 | $4,617 | $401,800 | $125,700 | $276,100 |
| 2023 | $4,261 | $347,300 | $107,700 | $239,600 |
| 2022 | $3,939 | $312,100 | $97,900 | $214,200 |
| 2021 | $3,747 | $270,900 | $90,600 | $180,300 |
| 2020 | $3,402 | $235,400 | $86,700 | $148,700 |
| 2019 | $3,241 | $222,300 | $82,600 | $139,700 |
| 2018 | $3,041 | $208,000 | $81,100 | $126,900 |
| 2017 | $2,859 | $204,200 | $82,700 | $121,500 |
| 2016 | $2,798 | $205,300 | $86,100 | $119,200 |
| 2015 | $2,586 | $197,700 | $83,000 | $114,700 |
| 2014 | $2,637 | $209,600 | $87,300 | $122,300 |
Source: Public Records
Map
Nearby Homes