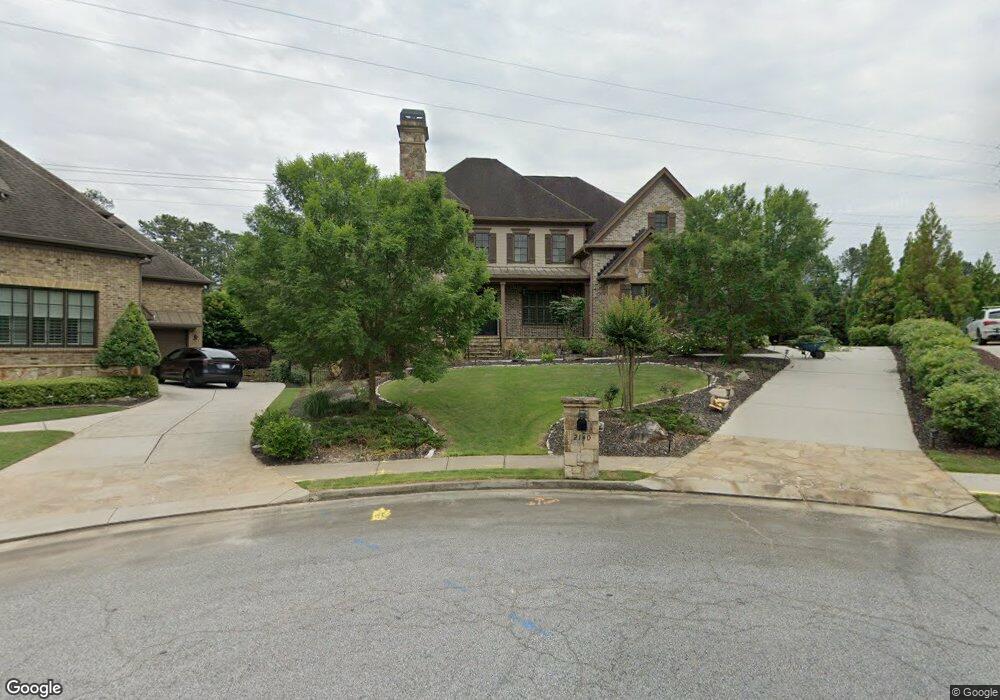
2140 Carlysle Croft Ct Unit 21 Marietta, GA 30062
East Cobb NeighborhoodEstimated Value: $1,680,552 - $2,074,000
5
Beds
6
Baths
5,583
Sq Ft
$346/Sq Ft
Est. Value
About This Home
This home is located at 2140 Carlysle Croft Ct Unit 21, Marietta, GA 30062 and is currently estimated at $1,934,388, approximately $346 per square foot. 2140 Carlysle Croft Ct Unit 21 is a home located in Cobb County with nearby schools including Timber Ridge Elementary School, Dodgen Middle School, and Walton High School.
Ownership History
Date
Name
Owned For
Owner Type
Purchase Details
Closed on
Jun 19, 2018
Sold by
Ali Roksana
Bought by
Phan Tri and Pham Jennifer H
Current Estimated Value
Home Financials for this Owner
Home Financials are based on the most recent Mortgage that was taken out on this home.
Original Mortgage
$787,000
Outstanding Balance
$577,656
Interest Rate
4.6%
Mortgage Type
New Conventional
Estimated Equity
$1,356,732
Purchase Details
Closed on
Aug 29, 2014
Sold by
Navkar Builders Llc
Bought by
Ali Roksana
Home Financials for this Owner
Home Financials are based on the most recent Mortgage that was taken out on this home.
Original Mortgage
$976,391
Interest Rate
4.1%
Mortgage Type
New Conventional
Purchase Details
Closed on
Dec 7, 2012
Sold by
Blount Construction Co Inc
Bought by
Navkar Builders Llc
Create a Home Valuation Report for This Property
The Home Valuation Report is an in-depth analysis detailing your home's value as well as a comparison with similar homes in the area
Home Values in the Area
Average Home Value in this Area
Purchase History
| Date | Buyer | Sale Price | Title Company |
|---|---|---|---|
| Phan Tri | $1,030,000 | -- | |
| Ali Roksana | $1,112,747 | -- | |
| Navkar Builders Llc | $570,000 | -- |
Source: Public Records
Mortgage History
| Date | Status | Borrower | Loan Amount |
|---|---|---|---|
| Open | Phan Tri | $787,000 | |
| Previous Owner | Ali Roksana | $976,391 |
Source: Public Records
Tax History Compared to Growth
Tax History
| Year | Tax Paid | Tax Assessment Tax Assessment Total Assessment is a certain percentage of the fair market value that is determined by local assessors to be the total taxable value of land and additions on the property. | Land | Improvement |
|---|---|---|---|---|
| 2025 | $16,605 | $616,296 | $140,000 | $476,296 |
| 2024 | $17,624 | $662,684 | $140,000 | $522,684 |
| 2023 | $12,317 | $443,060 | $100,000 | $343,060 |
| 2022 | $12,946 | $443,060 | $100,000 | $343,060 |
| 2021 | $12,946 | $443,060 | $100,000 | $343,060 |
| 2020 | $12,946 | $443,060 | $100,000 | $343,060 |
| 2019 | $12,231 | $412,000 | $114,000 | $298,000 |
| 2018 | $12,633 | $416,252 | $114,000 | $302,252 |
| 2017 | $12,230 | $425,392 | $114,000 | $311,392 |
| 2016 | $12,230 | $425,392 | $114,000 | $311,392 |
| 2015 | $12,261 | $416,192 | $104,800 | $311,392 |
| 2014 | $2,258 | $76,000 | $0 | $0 |
Source: Public Records
Map
Nearby Homes
- 1929 Fields Pond Glen
- 2212 Heritage Trace View
- 2255 Rushmore Dr
- 2066 Old Forge Way
- 1961 Fields Pond Dr
- 2039 Old Forge Way
- 1804 Shelburne Ridge
- 4789 Waterhaven Bend
- 5140 Timber Ridge Rd
- 5122 Timber Ridge Rd
- 5150 Timber Ridge Rd
- 1009 Lake Pointe Cir
- 5108 Nicolet Ct
- 4780 Waterhaven Bend
- 2743 Chimney Springs Dr
- 2655 Boulder Creek Dr NE
- 3113 Lake Pointe Cir
- 2140 Carlysle Croft Ct
- 2145 Carlysle Croft Ct
- 2150 Carlysle Croft Ct
- 2155 Carlysle Croft Ct
- 2160 Carlysle Croft Ct
- 0 Carlysle Croft Ct Unit 8973318
- 2115 Old Forge Way
- 5070 Heath Hollow Ln
- 5106 Heath Hollow Ln
- 2110 Old Forge Way Unit 1
- 0 Heath Hollow Ln Unit 8646625
- 0 Heath Hollow Ln Unit 7591810
- 0 Heath Hollow Ln Unit 8037142
- 5015 Willeo Rill Way
- 3180 Willeo Rill Rd
- 3280 Willeo Rill Rd
- 2127 Castlewycke Ct
- 5075 Heath Hollow Ln
- 2107 Old Forge Way
- 5105 Heath Hollow Ln