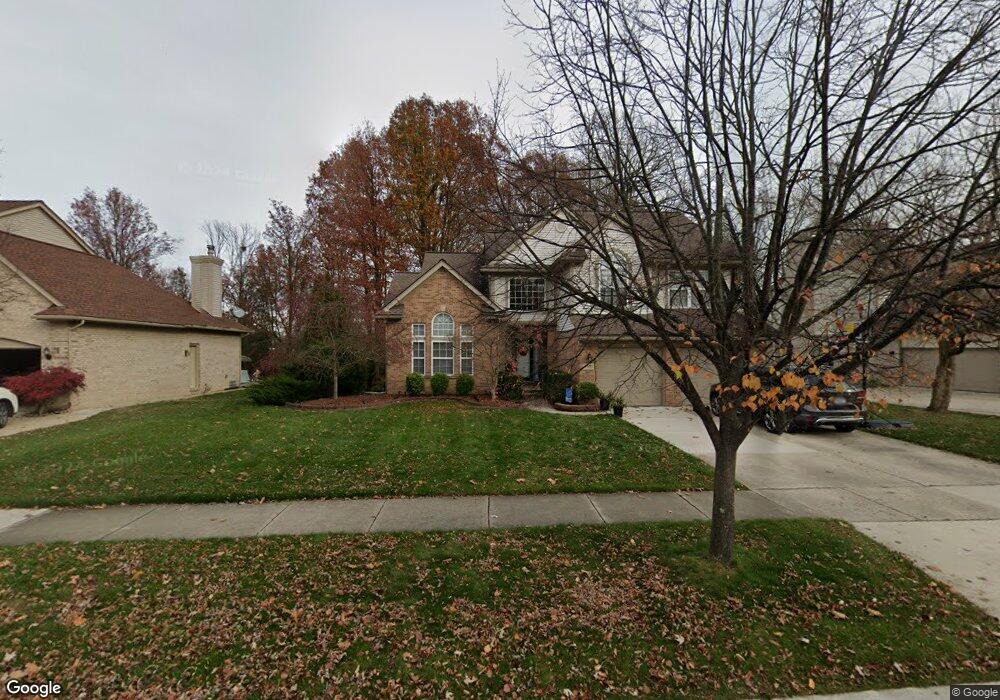
2140 Hendrie Unit Bldg-Unit Canton, MI 48187
Estimated Value: $550,000 - $615,000
Studio
4
Baths
2,559
Sq Ft
$223/Sq Ft
Est. Value
About This Home
This home is located at 2140 Hendrie Unit Bldg-Unit, Canton, MI 48187 and is currently estimated at $570,860, approximately $223 per square foot. 2140 Hendrie Unit Bldg-Unit is a home located in Wayne County with nearby schools including Canton High School, Discovery Middle School, and Plymouth High School.
Ownership History
Date
Name
Owned For
Owner Type
Purchase Details
Closed on
Feb 3, 2023
Sold by
Downey Alecia A
Bought by
Downey Joshua Douglas
Current Estimated Value
Purchase Details
Closed on
Aug 10, 2018
Sold by
Kannappan Vikram
Bought by
Downey Joshua Douglas and Downey Alicia A
Home Financials for this Owner
Home Financials are based on the most recent Mortgage that was taken out on this home.
Original Mortgage
$378,750
Interest Rate
4.5%
Mortgage Type
VA
Purchase Details
Closed on
Jun 17, 2016
Sold by
Mchutchion James W and Mchutchion Nancy K
Bought by
Kannappan Vikram and Asokan Ramya
Purchase Details
Closed on
Jul 22, 2014
Sold by
Mchutchion James W and Mchutchion Nancy K
Bought by
The James W & Nancy K Mchutchion Living
Purchase Details
Closed on
Aug 3, 2012
Sold by
Mchutchion James W and Mchutchion Nancy K
Bought by
The James W & Nancy K Mchutchion Living
Create a Home Valuation Report for This Property
The Home Valuation Report is an in-depth analysis detailing your home's value as well as a comparison with similar homes in the area
Home Values in the Area
Average Home Value in this Area
Purchase History
| Date | Buyer | Sale Price | Title Company |
|---|---|---|---|
| Downey Joshua Douglas | -- | -- | |
| Downey Joshua Douglas | $378,750 | Reputation First Title Agcy | |
| Kannappan Vikram | $365,000 | Title One Inc | |
| The James W & Nancy K Mchutchion Living | -- | None Available | |
| Mchutchion James W | -- | None Available | |
| The James W & Nancy K Mchutchion Living | -- | None Available |
Source: Public Records
Mortgage History
| Date | Status | Borrower | Loan Amount |
|---|---|---|---|
| Previous Owner | Downey Joshua Douglas | $378,750 |
Source: Public Records
Tax History
| Year | Tax Paid | Tax Assessment Tax Assessment Total Assessment is a certain percentage of the fair market value that is determined by local assessors to be the total taxable value of land and additions on the property. | Land | Improvement |
|---|---|---|---|---|
| 2025 | $3,734 | $234,500 | $0 | $0 |
| 2024 | $3,622 | $211,800 | $0 | $0 |
| 2023 | $3,453 | $206,700 | $0 | $0 |
| 2022 | $7,458 | $183,100 | $0 | $0 |
| 2021 | $7,237 | $176,300 | $0 | $0 |
| 2020 | $7,194 | $175,000 | $0 | $0 |
| 2019 | $7,062 | $171,790 | $0 | $0 |
| 2018 | $2,961 | $168,120 | $0 | $0 |
| 2017 | $7,288 | $167,100 | $0 | $0 |
| 2016 | $4,805 | $171,000 | $0 | $0 |
| 2015 | $12,065 | $153,130 | $0 | $0 |
| 2013 | $11,688 | $131,640 | $0 | $0 |
| 2010 | -- | $117,600 | $53,989 | $63,611 |
Source: Public Records
Map
Nearby Homes
- 00000 Maben Rd
- 1632 Peninsula Ct Unit 159
- 1055 Ashton Woods Dr Unit 1
- 1289 Old Colony Ln Unit 232
- 47651 Red Run Dr
- 1285 W Crystal Cir Unit 214
- 47105 Larchmont Dr
- 1276 W Crystal Cir Unit 202
- 1584 Commodore Cir Unit 33
- 1215 Orchid Cir
- 0000 Ford
- 45678 Aragon Ln
- 6450 Gallery Dr
- 45863 Baywood Blvd
- 8517 N Beck Rd
- 48107 Hanford Rd
- 48590 Ford Rd
- 45005 Saltz Rd
- 5885 Fairborn Dr
- 48030 Cherry Hill Rd
Your Personal Tour Guide
Ask me questions while you tour the home.