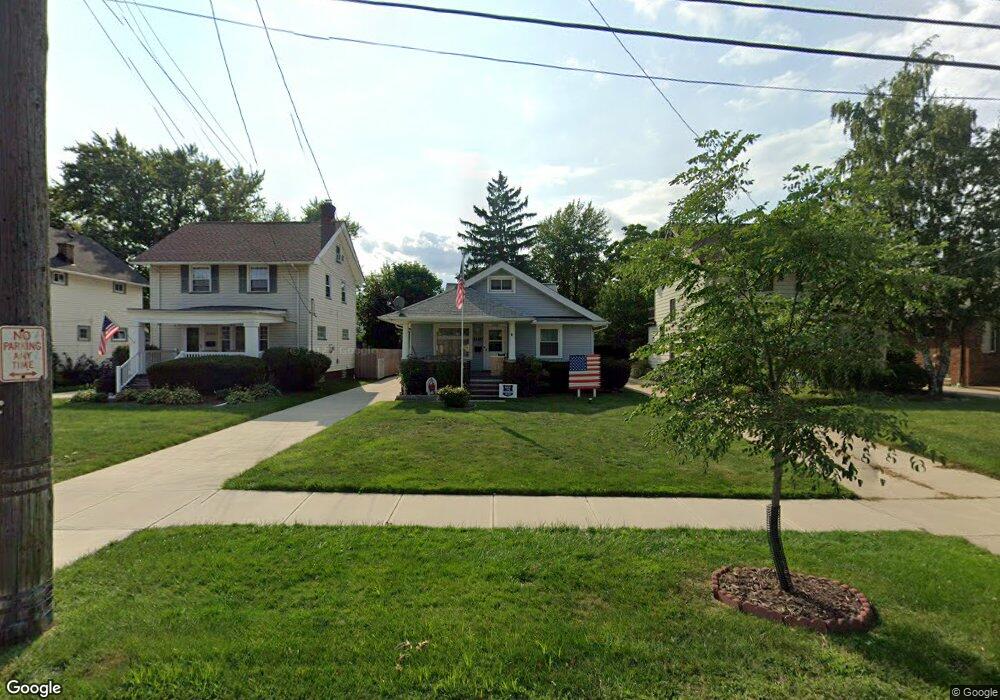
2140 Woodward Ave Lakewood, OH 44107
Estimated Value: $262,805 - $310,000
2
Beds
1
Bath
1,518
Sq Ft
$193/Sq Ft
Est. Value
About This Home
This home is located at 2140 Woodward Ave, Lakewood, OH 44107 and is currently estimated at $293,201, approximately $193 per square foot. 2140 Woodward Ave is a home located in Cuyahoga County with nearby schools including Hayes Elementary School, Harding Middle School, and Lakewood High School.
Ownership History
Date
Name
Owned For
Owner Type
Purchase Details
Closed on
Oct 13, 1995
Sold by
Hazeldine Arthur
Bought by
Sinatra Jimmie S and Sinatra Barbara A
Current Estimated Value
Home Financials for this Owner
Home Financials are based on the most recent Mortgage that was taken out on this home.
Original Mortgage
$89,500
Interest Rate
7.8%
Mortgage Type
New Conventional
Purchase Details
Closed on
Jul 22, 1986
Sold by
Rasch Andrea A
Bought by
Hazeldine Arthur and Hazeldine Jean K
Purchase Details
Closed on
Jul 15, 1982
Sold by
Baran Gary S
Bought by
Rasch Andrea A
Purchase Details
Closed on
May 24, 1977
Sold by
Jericho Robert W
Bought by
Baran Gary S
Purchase Details
Closed on
Mar 17, 1976
Sold by
Jerico Robert W
Bought by
Jericho Robert W
Purchase Details
Closed on
Jan 1, 1975
Bought by
Sears Irvin T and Sears Gladys I
Create a Home Valuation Report for This Property
The Home Valuation Report is an in-depth analysis detailing your home's value as well as a comparison with similar homes in the area
Home Values in the Area
Average Home Value in this Area
Purchase History
| Date | Buyer | Sale Price | Title Company |
|---|---|---|---|
| Sinatra Jimmie S | $89,500 | -- | |
| Hazeldine Arthur | $55,000 | -- | |
| Rasch Andrea A | $50,900 | -- | |
| Baran Gary S | $36,000 | -- | |
| Jericho Robert W | $15,000 | -- | |
| Jerico Robert W | $15,000 | -- | |
| Sears Irvin T | -- | -- |
Source: Public Records
Mortgage History
| Date | Status | Borrower | Loan Amount |
|---|---|---|---|
| Previous Owner | Sinatra Jimmie S | $89,500 |
Source: Public Records
Tax History Compared to Growth
Tax History
| Year | Tax Paid | Tax Assessment Tax Assessment Total Assessment is a certain percentage of the fair market value that is determined by local assessors to be the total taxable value of land and additions on the property. | Land | Improvement |
|---|---|---|---|---|
| 2024 | $3,936 | $71,085 | $19,005 | $52,080 |
| 2023 | $4,582 | $70,220 | $16,210 | $54,010 |
| 2022 | $4,643 | $70,210 | $16,210 | $54,010 |
| 2021 | $4,596 | $70,210 | $16,210 | $54,010 |
| 2020 | $3,907 | $54,430 | $12,570 | $41,860 |
| 2019 | $3,830 | $155,500 | $35,900 | $119,600 |
| 2018 | $3,824 | $54,430 | $12,570 | $41,860 |
| 2017 | $3,197 | $43,440 | $9,590 | $33,850 |
| 2016 | $3,175 | $43,440 | $9,590 | $33,850 |
| 2015 | $3,144 | $43,440 | $9,590 | $33,850 |
| 2014 | $3,144 | $41,760 | $9,210 | $32,550 |
Source: Public Records
Map
Nearby Homes
- 2209 Woodward Ave
- 2239 Woodward Ave
- 2223 Eldred Ave
- 2234 Olive Ave
- 2192 Glenbury Ave
- 1615 Wagar Ave
- 2087 Lakeland Ave
- 1617 Westwood Ave
- 2111 Overbrook Ave
- 15555 Hilliard Rd Unit 401A
- 1563 Wagar Ave
- 17322 Archdale Ave
- 2165 Arthur Ave
- 1547 Orchard Grove Ave
- 1542 Westwood Ave
- 1507 Orchard Grove Ave
- 15615 Fernway Ave
- 1500 Lauderdale Ave
- 1578 Mars Ave
- 14924 Arden Ave
- 2144 Woodward Ave
- 2136 Woodward Ave
- 2134 Woodward Ave
- 2146 Woodward Ave
- 2150 Woodward Ave
- 2121 Eldred Ave
- 2117 Eldred Ave
- 2125 Eldred Ave
- 2113 Eldred Ave
- 2154 Woodward Ave
- 2127 Eldred Ave
- 2139 Woodward Ave
- 2141 Woodward Ave
- 2135 Woodward Ave
- 2147 Woodward Ave
- 2131 Eldred Ave
- 2129 Woodward Ave
- 2133 Eldred Ave
- 16605 Hilliard Rd
- 2158 Woodward Ave