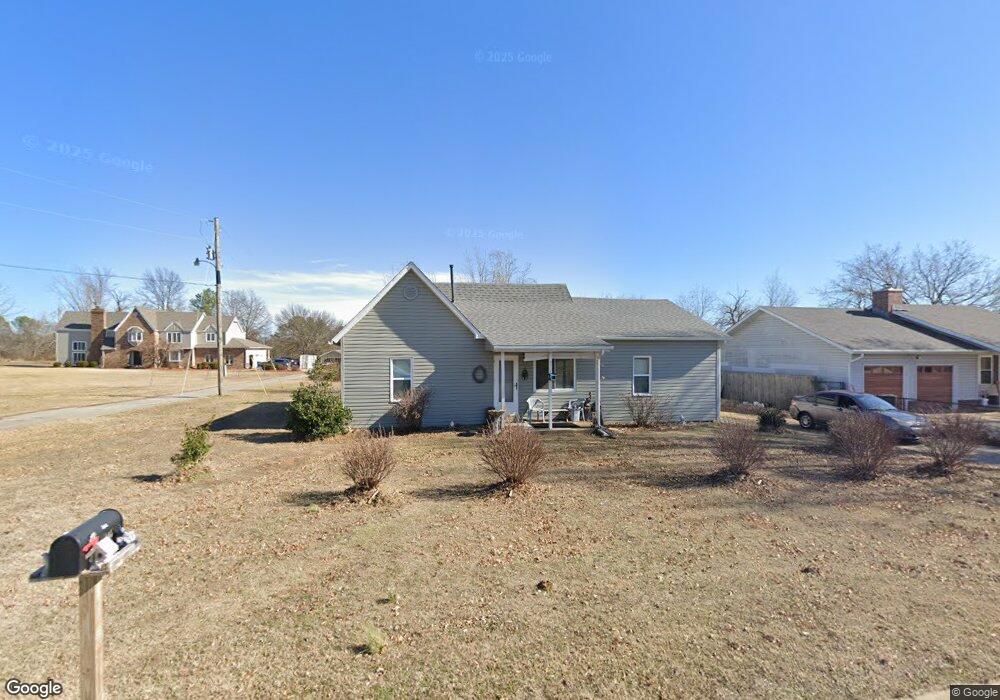
2141 S 21st St Rogers, AR 72758
Estimated Value: $253,486 - $370,000
--
Bed
1
Bath
1,281
Sq Ft
$241/Sq Ft
Est. Value
About This Home
This home is located at 2141 S 21st St, Rogers, AR 72758 and is currently estimated at $309,122, approximately $241 per square foot. 2141 S 21st St is a home located in Benton County with nearby schools including Bellview Elementary School, Kirksey Middle School, and Rogers High School.
Ownership History
Date
Name
Owned For
Owner Type
Purchase Details
Closed on
May 15, 2007
Sold by
Hickmon Lillian O
Bought by
Lillian O Hickman Revocable Living Trust
Current Estimated Value
Purchase Details
Closed on
Jul 5, 2006
Sold by
Laman Kerry M and Laman Regina
Bought by
Irvine Keith L
Home Financials for this Owner
Home Financials are based on the most recent Mortgage that was taken out on this home.
Original Mortgage
$83,200
Interest Rate
6.6%
Mortgage Type
Purchase Money Mortgage
Purchase Details
Closed on
Jan 14, 1993
Bought by
Dod 01-14-1993
Purchase Details
Closed on
Sep 16, 1992
Bought by
Hickmon
Purchase Details
Closed on
Mar 25, 1991
Bought by
Butler
Purchase Details
Closed on
Jul 8, 1987
Bought by
Luper
Purchase Details
Closed on
May 19, 1986
Bought by
Prophet
Create a Home Valuation Report for This Property
The Home Valuation Report is an in-depth analysis detailing your home's value as well as a comparison with similar homes in the area
Home Values in the Area
Average Home Value in this Area
Purchase History
| Date | Buyer | Sale Price | Title Company |
|---|---|---|---|
| Lillian O Hickman Revocable Living Trust | -- | None Available | |
| Irvine Keith L | $88,000 | None Available | |
| Dod 01-14-1993 | -- | -- | |
| Hickmon | $28,000 | -- | |
| Butler | $190,000 | -- | |
| Luper | $6,000 | -- | |
| Prophet | $50,000 | -- |
Source: Public Records
Mortgage History
| Date | Status | Borrower | Loan Amount |
|---|---|---|---|
| Previous Owner | Irvine Keith L | $83,200 |
Source: Public Records
Tax History Compared to Growth
Tax History
| Year | Tax Paid | Tax Assessment Tax Assessment Total Assessment is a certain percentage of the fair market value that is determined by local assessors to be the total taxable value of land and additions on the property. | Land | Improvement |
|---|---|---|---|---|
| 2025 | $871 | $44,942 | $25,000 | $19,942 |
| 2024 | $850 | $44,942 | $25,000 | $19,942 |
| 2023 | $850 | $24,110 | $12,000 | $12,110 |
| 2022 | $508 | $24,110 | $12,000 | $12,110 |
| 2021 | $506 | $24,110 | $12,000 | $12,110 |
| 2020 | $465 | $22,170 | $13,200 | $8,970 |
| 2019 | $431 | $22,170 | $13,200 | $8,970 |
| 2018 | $423 | $22,170 | $13,200 | $8,970 |
| 2017 | $317 | $22,170 | $13,200 | $8,970 |
| 2016 | $317 | $22,170 | $13,200 | $8,970 |
| 2015 | $642 | $12,140 | $5,000 | $7,140 |
| 2014 | $292 | $12,140 | $5,000 | $7,140 |
Source: Public Records
Map
Nearby Homes
- 2140 S 21st St
- 2235 S Dixieland Rd
- 1704 & 1710 S Dixieland Rd
- 1705 W Cottonwood St
- 2100 W New Hope Rd Unit 1504
- 2100 W New Hope Rd Unit 2304
- 2006 S 17th St
- 3054 W Berkeley Ave
- 3058 W Berkeley Ave
- 1726 W Berkeley Ave
- 2301 S 17th St
- 2006 S 16th St
- Lot 1 W New Hope Rd
- 2430 S 26th St
- 1607 W New Hope Rd
- 2703 S 20th Place
- 2428 S 26th St
- TBD W Madison Dr
- 2600 Bonnie Ln
- 2610 Bonnie Ln
- 2143 S 21st St
- 2011 W Linda Ln
- 2009 W Linda Ln
- 2131 S 21st St
- 2007 W Linda Ln
- 2121 S 21st St
- 2222 S 21st St
- 2130 S 21st St
- 2003 W Linda Ln
- 2010 W Linda Ln
- 2008 W Linda Ln
- 2001 W Linda Ln
- 2006 W Linda Ln
- 2224 S 21st St
- 2119 S 21st St
- 2004 W Linda Ln
- 1911 W Linda Ln
- 2002 W Linda Ln
- 2120 S 21st St
- 2011 Morter Place