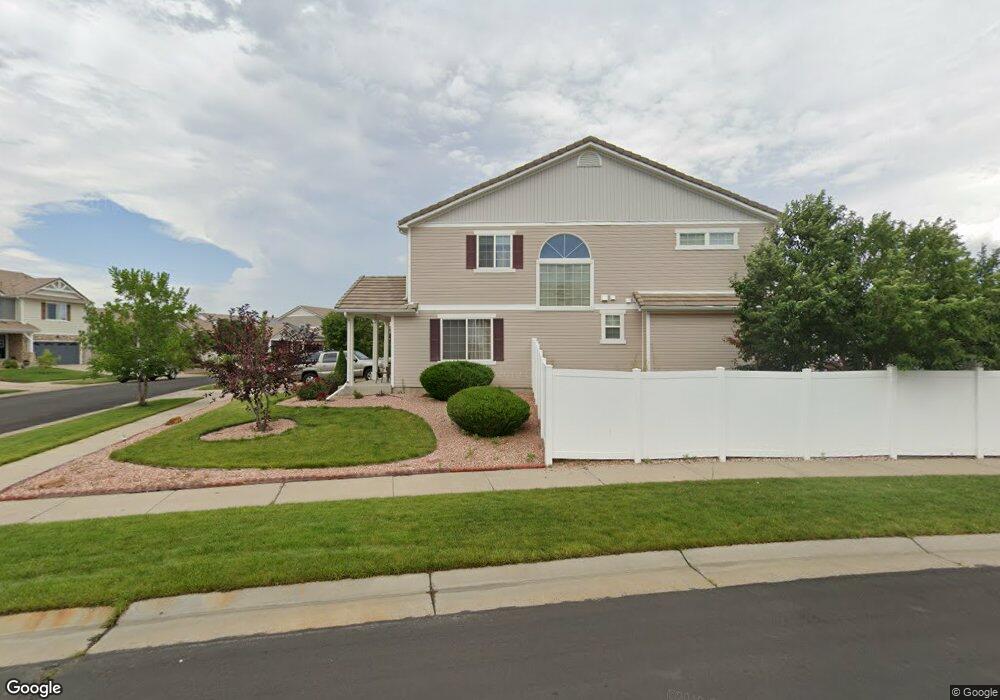
21410 54th Place Denver, CO 80249
Green Valley Ranch NeighborhoodEstimated Value: $548,101 - $608,000
5
Beds
3
Baths
3,806
Sq Ft
$152/Sq Ft
Est. Value
About This Home
This home is located at 21410 54th Place, Denver, CO 80249 and is currently estimated at $579,775, approximately $152 per square foot. 21410 54th Place is a home located in Denver County with nearby schools including Pitt-Waller K-8 School, McGlone Academy, and Marie L. Greenwood Academy.
Ownership History
Date
Name
Owned For
Owner Type
Purchase Details
Closed on
Jun 18, 2021
Sold by
Figaro Evasly G and Figaro Clarene
Bought by
Figaro Clarene
Current Estimated Value
Home Financials for this Owner
Home Financials are based on the most recent Mortgage that was taken out on this home.
Original Mortgage
$412,400
Outstanding Balance
$373,551
Interest Rate
2.93%
Mortgage Type
New Conventional
Estimated Equity
$206,224
Purchase Details
Closed on
Dec 5, 2007
Sold by
Figaro Evasly G
Bought by
Figaro Evasly G and Figaro Clareen
Home Financials for this Owner
Home Financials are based on the most recent Mortgage that was taken out on this home.
Original Mortgage
$221,950
Interest Rate
6.27%
Mortgage Type
New Conventional
Purchase Details
Closed on
Oct 3, 2005
Sold by
Oakwood Homes Llc
Bought by
Figaro Evasly G
Home Financials for this Owner
Home Financials are based on the most recent Mortgage that was taken out on this home.
Original Mortgage
$211,050
Interest Rate
6.5%
Mortgage Type
Fannie Mae Freddie Mac
Create a Home Valuation Report for This Property
The Home Valuation Report is an in-depth analysis detailing your home's value as well as a comparison with similar homes in the area
Home Values in the Area
Average Home Value in this Area
Purchase History
| Date | Buyer | Sale Price | Title Company |
|---|---|---|---|
| Figaro Clarene | -- | None Available | |
| Figaro Evasly G | -- | Chicago Title Co | |
| Figaro Evasly G | $263,900 | Town & Country Title Service |
Source: Public Records
Mortgage History
| Date | Status | Borrower | Loan Amount |
|---|---|---|---|
| Open | Figaro Clarene | $412,400 | |
| Closed | Figaro Evasly G | $221,950 | |
| Closed | Figaro Evasly G | $211,050 |
Source: Public Records
Tax History Compared to Growth
Tax History
| Year | Tax Paid | Tax Assessment Tax Assessment Total Assessment is a certain percentage of the fair market value that is determined by local assessors to be the total taxable value of land and additions on the property. | Land | Improvement |
|---|---|---|---|---|
| 2024 | $4,630 | $36,190 | $3,820 | $32,370 |
| 2023 | $4,457 | $36,190 | $3,820 | $32,370 |
| 2022 | $3,448 | $25,900 | $6,750 | $19,150 |
| 2021 | $3,448 | $26,640 | $6,940 | $19,700 |
| 2020 | $3,652 | $27,560 | $6,770 | $20,790 |
| 2019 | $3,595 | $27,560 | $6,770 | $20,790 |
| 2018 | $3,125 | $23,080 | $4,200 | $18,880 |
| 2017 | $3,877 | $23,080 | $4,200 | $18,880 |
| 2016 | $3,478 | $21,010 | $4,060 | $16,950 |
| 2015 | $3,406 | $21,010 | $4,060 | $16,950 |
| 2014 | $2,279 | $14,420 | $2,388 | $12,032 |
Source: Public Records
Map
Nearby Homes
- 21476 E 53rd Place
- 21313 E 55th Ave
- 21488 Randolph Place
- 5535 Nepal St
- 5550 Malta St
- 5567 Malta St
- 5293 Malaya St
- 21815 E 51st Dr
- 21865 E 51st Dr
- 21825 E 51st Dr
- 5541 Lisbon St
- 5134 Malaya St
- 21855 E 51st Dr
- 21835 E 51st Dr
- 21885 E 51st Dr
- 21895 E 51st Dr
- 21927 E 51st Dr
- 21905 E 51st Dr
- 21915 E 51st Dr
- 5120 Perth St
- 21420 54th Place
- 21419 54th Ave
- 21429 54th Ave
- 5411 Odessa St
- 21440 54th Place
- 21403 54th Place
- 5421 Odessa St
- 21459 54th Ave
- 5403 Odessa St
- 21459 E 54th Ave
- 21413 54th Place
- 21470 E 54th Place
- 21423 54th Place
- 21443 54th Place
- 21470 54th Place
- 21443 E 54th Place
- 21453 54th Place
- 5441 Odessa St
- 21479 E 54th Ave
- 21479 54th Ave