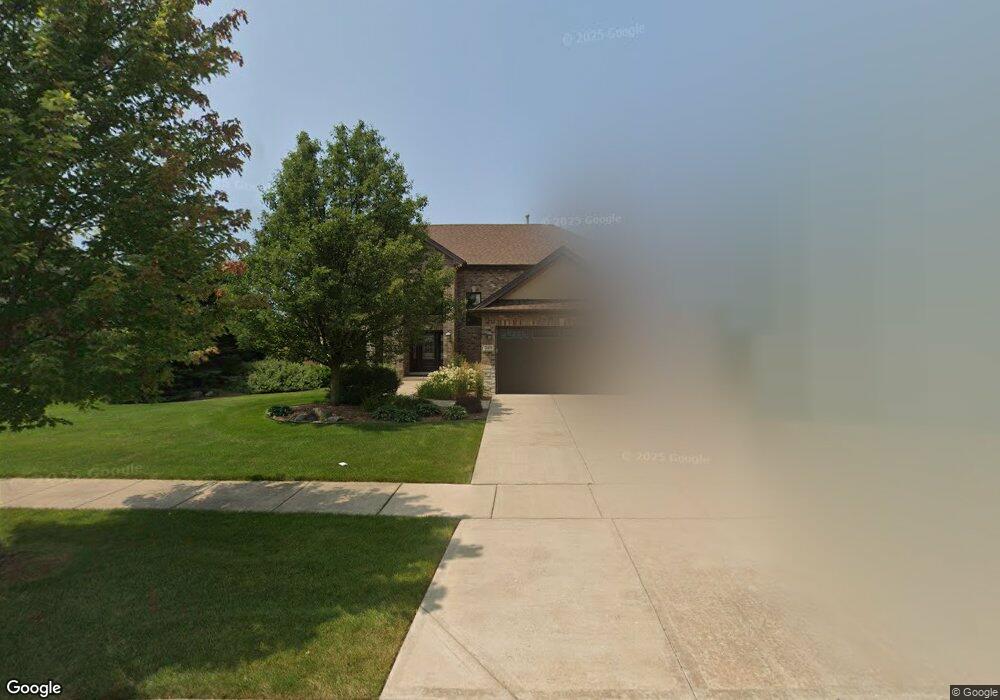
21410 Foxtail Dr Mokena, IL 60448
Estimated Value: $727,614 - $811,000
Studio
--
Bath
3,330
Sq Ft
$233/Sq Ft
Est. Value
About This Home
This home is located at 21410 Foxtail Dr, Mokena, IL 60448 and is currently estimated at $775,404, approximately $232 per square foot. 21410 Foxtail Dr is a home located in Will County with nearby schools including Mokena Elementary School, Mokena Intermediate School, and Mokena Jr High School.
Ownership History
Date
Name
Owned For
Owner Type
Purchase Details
Closed on
Apr 18, 2025
Sold by
Crowley Jeffery F and Crowley Shannon C
Bought by
Jeffery And Shannon Crowley Living Trust and Crowley
Current Estimated Value
Purchase Details
Closed on
Jul 27, 2010
Sold by
Dublin Builders Inc
Bought by
Crowley Jeffrey F and Crowley Shannon C
Home Financials for this Owner
Home Financials are based on the most recent Mortgage that was taken out on this home.
Original Mortgage
$396,139
Interest Rate
4.63%
Mortgage Type
New Conventional
Purchase Details
Closed on
Apr 16, 2010
Sold by
Bslb Llc
Bought by
Dublin Builders Inc
Home Financials for this Owner
Home Financials are based on the most recent Mortgage that was taken out on this home.
Original Mortgage
$63,750
Interest Rate
3.25%
Mortgage Type
Future Advance Clause Open End Mortgage
Purchase Details
Closed on
Mar 23, 2010
Sold by
State Bank Of Countryside
Bought by
Bslb Llc
Home Financials for this Owner
Home Financials are based on the most recent Mortgage that was taken out on this home.
Original Mortgage
$63,750
Interest Rate
3.25%
Mortgage Type
Future Advance Clause Open End Mortgage
Create a Home Valuation Report for This Property
The Home Valuation Report is an in-depth analysis detailing your home's value as well as a comparison with similar homes in the area
Home Values in the Area
Average Home Value in this Area
Purchase History
| Date | Buyer | Sale Price | Title Company |
|---|---|---|---|
| Jeffery And Shannon Crowley Living Trust | -- | None Listed On Document | |
| Crowley Jeffrey F | $440,155 | Attorneys Title Guaranty Fun | |
| Dublin Builders Inc | $85,000 | Prairie Title Inc | |
| Bslb Llc | -- | Chicago Title Insurance Co |
Source: Public Records
Mortgage History
| Date | Status | Borrower | Loan Amount |
|---|---|---|---|
| Previous Owner | Crowley Jeffrey F | $396,139 | |
| Previous Owner | Dublin Builders Inc | $63,750 |
Source: Public Records
Tax History
| Year | Tax Paid | Tax Assessment Tax Assessment Total Assessment is a certain percentage of the fair market value that is determined by local assessors to be the total taxable value of land and additions on the property. | Land | Improvement |
|---|---|---|---|---|
| 2024 | $15,719 | $221,221 | $24,258 | $196,963 |
| 2023 | $15,719 | $197,572 | $21,665 | $175,907 |
| 2022 | $13,773 | $179,954 | $19,733 | $160,221 |
| 2021 | $13,010 | $168,354 | $18,461 | $149,893 |
| 2020 | $12,743 | $163,610 | $17,941 | $145,669 |
| 2019 | $12,350 | $159,231 | $17,461 | $141,770 |
| 2018 | $10,751 | $154,653 | $16,959 | $137,694 |
| 2017 | $9,724 | $151,043 | $16,563 | $134,480 |
| 2016 | $11,165 | $167,550 | $32,967 | $134,583 |
| 2015 | $10,387 | $161,650 | $31,806 | $129,844 |
| 2014 | $10,387 | $145,526 | $31,585 | $113,941 |
| 2013 | $10,387 | $132,413 | $31,995 | $100,418 |
Source: Public Records
Map
Nearby Homes
- 21647 S Owens Rd
- 21334 Sage Brush Ln
- 21170 Sage Brush Ln
- 21580 Skyway Dr
- 11140 Lincoln Hwy
- 1750 Orchard Ln
- 732 Teal Dr Unit 1
- 1738 Orchard Ln
- 1564 Glenbrooke Ln Unit 2
- 1558 Glenbrooke Ln
- 21942 Princeton Cir
- 1747 Lakes Park Dr
- 2647 Dundee Dr
- 1741 Lakes Park Dr
- 1823 Lakes Park Dr
- 2605 Dundee Dr
- 1815 Lakes Park Dr
- 1807 Lakes Park Dr
- 2609 Dundee Dr
- 2628 Dundee Dr
- 21420 Foxtail Dr
- 21340 Foxtail Dr
- 21351 Foxtail Dr
- 21419 Foxtail Dr
- 21430 Foxtail Dr
- 21341 Foxtail Dr
- 21330 Foxtail Dr
- 21429 Foxtail Dr
- 21331 Foxtail Dr
- 21408 Prairie Ridge Dr
- 21440 Foxtail Dr
- 21358 Prairie Ridge Dr
- 21320 Foxtail Dr
- 21418 Prairie Ridge Dr
- 21348 Prairie Ridge Dr
- 21409 Sage Brush Ln
- 21439 Foxtail Dr
- 21321 Foxtail Dr
- 21428 Prairie Ridge Dr
- 21338 Prairie Ridge Dr
Your Personal Tour Guide
Ask me questions while you tour the home.