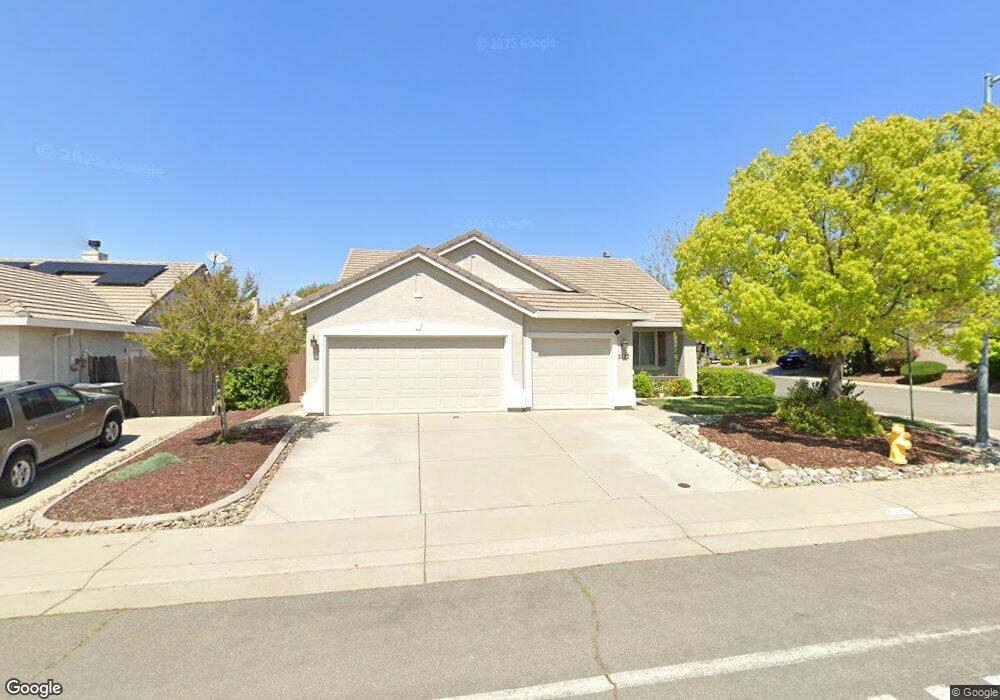
2142 3rd St Unit 4B Lincoln, CA 95648
Estimated Value: $545,000 - $561,000
3
Beds
2
Baths
1,833
Sq Ft
$300/Sq Ft
Est. Value
About This Home
This home is located at 2142 3rd St Unit 4B, Lincoln, CA 95648 and is currently estimated at $550,698, approximately $300 per square foot. 2142 3rd St Unit 4B is a home located in Placer County with nearby schools including Creekside Oaks Elementary, Glen Edwards Middle, and Lincoln High.
Ownership History
Date
Name
Owned For
Owner Type
Purchase Details
Closed on
Jul 29, 2020
Sold by
Jones April M
Bought by
Jones April Marie
Current Estimated Value
Purchase Details
Closed on
Oct 18, 2011
Sold by
Ellis James C and Jacklett Ellis Jodie
Bought by
Jones April M
Home Financials for this Owner
Home Financials are based on the most recent Mortgage that was taken out on this home.
Original Mortgage
$229,591
Outstanding Balance
$155,909
Interest Rate
4.01%
Mortgage Type
New Conventional
Estimated Equity
$394,789
Purchase Details
Closed on
May 15, 2003
Sold by
Va
Bought by
Ellis James C and Jacklett Ellis Jodie
Home Financials for this Owner
Home Financials are based on the most recent Mortgage that was taken out on this home.
Original Mortgage
$216,500
Interest Rate
4.62%
Mortgage Type
Purchase Money Mortgage
Purchase Details
Closed on
Jun 19, 2000
Sold by
Beazer Homes Holdings Corp
Bought by
Va
Create a Home Valuation Report for This Property
The Home Valuation Report is an in-depth analysis detailing your home's value as well as a comparison with similar homes in the area
Home Values in the Area
Average Home Value in this Area
Purchase History
| Date | Buyer | Sale Price | Title Company |
|---|---|---|---|
| Jones April Marie | -- | None Available | |
| Jones April M | $225,000 | Stewart Title Of Placer | |
| Ellis James C | -- | Fidelity Title | |
| Va | $186,500 | First American Title Ins Co |
Source: Public Records
Mortgage History
| Date | Status | Borrower | Loan Amount |
|---|---|---|---|
| Open | Jones April M | $229,591 | |
| Previous Owner | Ellis James C | $216,500 |
Source: Public Records
Tax History
| Year | Tax Paid | Tax Assessment Tax Assessment Total Assessment is a certain percentage of the fair market value that is determined by local assessors to be the total taxable value of land and additions on the property. | Land | Improvement |
|---|---|---|---|---|
| 2025 | $3,018 | $282,599 | $94,198 | $188,401 |
| 2023 | $3,018 | $271,627 | $90,541 | $181,086 |
| 2022 | $2,936 | $266,302 | $88,766 | $177,536 |
| 2021 | $2,880 | $261,081 | $87,026 | $174,055 |
| 2020 | $2,791 | $258,405 | $86,134 | $172,271 |
| 2019 | $2,718 | $253,340 | $84,446 | $168,894 |
| 2018 | $2,652 | $248,374 | $82,791 | $165,583 |
| 2017 | $2,568 | $243,505 | $81,168 | $162,337 |
| 2016 | $2,507 | $238,731 | $79,577 | $159,154 |
Source: Public Records
Map
Nearby Homes
- 2006 Butterfield Ln
- 2013 Butterfield Ln
- 127 Fuller Ln
- 1983 Milan Way
- 1736 Grand Breeze Ln Unit 74
- 721 Aberdeen Ln
- 2116 Abbeyhill Rd
- 390 Lexington Ct
- 343 Phoenix Cir
- 998 Fullerton Ranch Rd
- 2801 Delegate Dr
- 2746 Delegate Dr
- 1743 Laehr Dr
- 2837 Delegate Dr
- 2770 Delegate Dr
- 2794 Delegate Dr
- 2185 Donovan Dr
- 2647 1st St
- 2879 Porcelain St
- 2867 Porcelain St
Your Personal Tour Guide
Ask me questions while you tour the home.