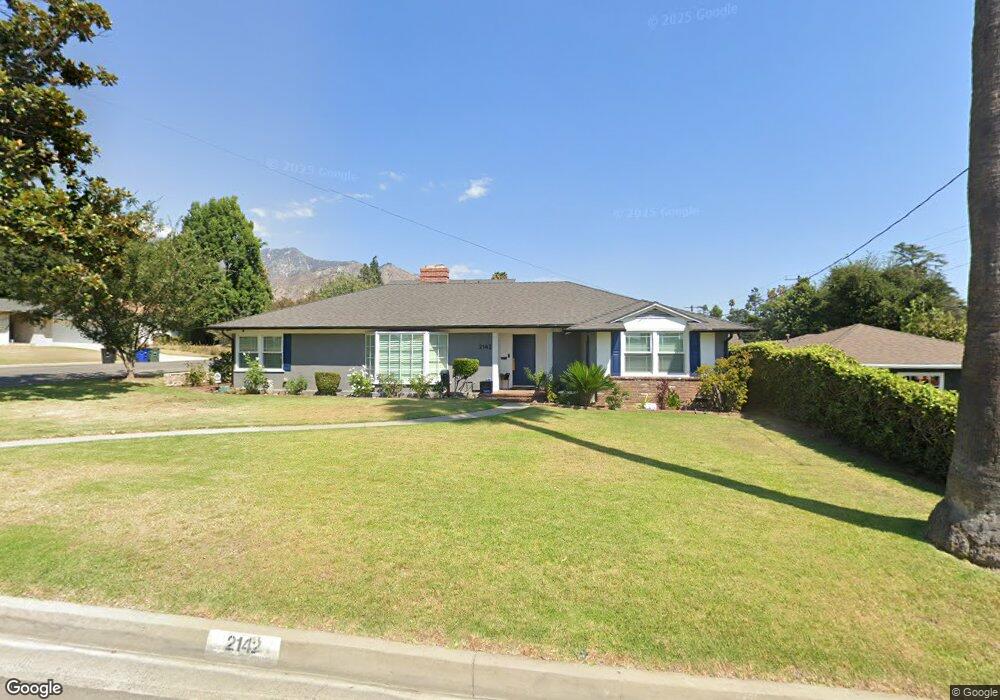
2142 Mar Vista Ave Altadena, CA 91001
Estimated Value: $1,015,000 - $1,673,187
3
Beds
3
Baths
2,601
Sq Ft
$482/Sq Ft
Est. Value
About This Home
This home is located at 2142 Mar Vista Ave, Altadena, CA 91001 and is currently estimated at $1,254,729, approximately $482 per square foot. 2142 Mar Vista Ave is a home located in Los Angeles County with nearby schools including Altadena Arts Magnet Elementary, Charles W. Eliot Arts Magnet Academy, and Pasadena High School.
Ownership History
Date
Name
Owned For
Owner Type
Purchase Details
Closed on
Nov 16, 2009
Sold by
Young David Michael and Breuer Rebecca
Bought by
Palmstrom Eric John and Palmstrom Marci Jean
Current Estimated Value
Home Financials for this Owner
Home Financials are based on the most recent Mortgage that was taken out on this home.
Original Mortgage
$600,000
Outstanding Balance
$388,357
Interest Rate
4.83%
Mortgage Type
New Conventional
Estimated Equity
$866,372
Purchase Details
Closed on
Oct 7, 1999
Sold by
Young Charlotte F
Bought by
Young Charlotte and The Charlotte Young Revocable
Purchase Details
Closed on
Apr 17, 1995
Sold by
Morris Robert E and Morris Mitra
Bought by
Young Charlotte F
Home Financials for this Owner
Home Financials are based on the most recent Mortgage that was taken out on this home.
Original Mortgage
$264,000
Interest Rate
8%
Create a Home Valuation Report for This Property
The Home Valuation Report is an in-depth analysis detailing your home's value as well as a comparison with similar homes in the area
Home Values in the Area
Average Home Value in this Area
Purchase History
| Date | Buyer | Sale Price | Title Company |
|---|---|---|---|
| Palmstrom Eric John | $750,000 | Equity Title | |
| Young Charlotte | -- | -- | |
| Young Charlotte F | $330,000 | Southland Title |
Source: Public Records
Mortgage History
| Date | Status | Borrower | Loan Amount |
|---|---|---|---|
| Open | Palmstrom Eric John | $600,000 | |
| Previous Owner | Young Charlotte F | $264,000 |
Source: Public Records
Tax History
| Year | Tax Paid | Tax Assessment Tax Assessment Total Assessment is a certain percentage of the fair market value that is determined by local assessors to be the total taxable value of land and additions on the property. | Land | Improvement |
|---|---|---|---|---|
| 2025 | $11,173 | $871,294 | $561,928 | $309,366 |
| 2024 | $11,173 | $949,122 | $612,122 | $337,000 |
| 2023 | $11,077 | $930,513 | $600,120 | $330,393 |
| 2022 | $10,695 | $912,268 | $588,353 | $323,915 |
| 2021 | $10,132 | $894,381 | $576,817 | $317,564 |
| 2019 | $9,753 | $867,855 | $559,709 | $308,146 |
| 2018 | $9,888 | $850,839 | $548,735 | $302,104 |
| 2016 | $9,626 | $817,802 | $527,428 | $290,374 |
| 2015 | $9,473 | $805,519 | $519,506 | $286,013 |
| 2014 | $9,274 | $789,741 | $509,330 | $280,411 |
Source: Public Records
Map
Nearby Homes
- 2186 Mar Vista Ave
- 2243 Mar Vista Ave
- 1299 Boston St
- 2032 Lewis Ave
- 1200 Morada Place
- 1920 Maiden Ln
- 1052 New York Dr
- 2469 Holliston Ave
- 801 E Mendocino St Unit 4A
- 1485 E Mendocino St
- 2560 Maiden Ln
- 2574 Ganesha Ave
- 1290 E Woodbury Rd
- 912 E Altadena Dr
- 2548 El Molino Ave
- 1371 El Corto Dr
- 1578 Morada Place
- 2630 Homepark Ave
- 744 New York Dr
- 1680 N Mar Vista Ave
- 2128 Mar Vista Ave
- 1160 Meadowbrook Rd
- 2120 Mar Vista Ave
- 1139 Meadowbrook Rd
- 1168 Meadowbrook Rd
- 1159 Meadowbrook Rd
- 2143 Mar Vista Ave
- 2133 Mar Vista Ave
- 1161 Boston St
- 1176 Meadowbrook Rd
- 2153 Mar Vista Ave
- 2110 Mar Vista Ave
- 2174 Mar Vista Ave
- 1169 Meadowbrook Rd
- 2125 Mar Vista Ave
- 2163 Mar Vista Ave
- 1169 Boston St
- 2115 Mar Vista Ave
- 1177 Meadowbrook Rd
- 1186 Meadowbrook Rd
Your Personal Tour Guide
Ask me questions while you tour the home.