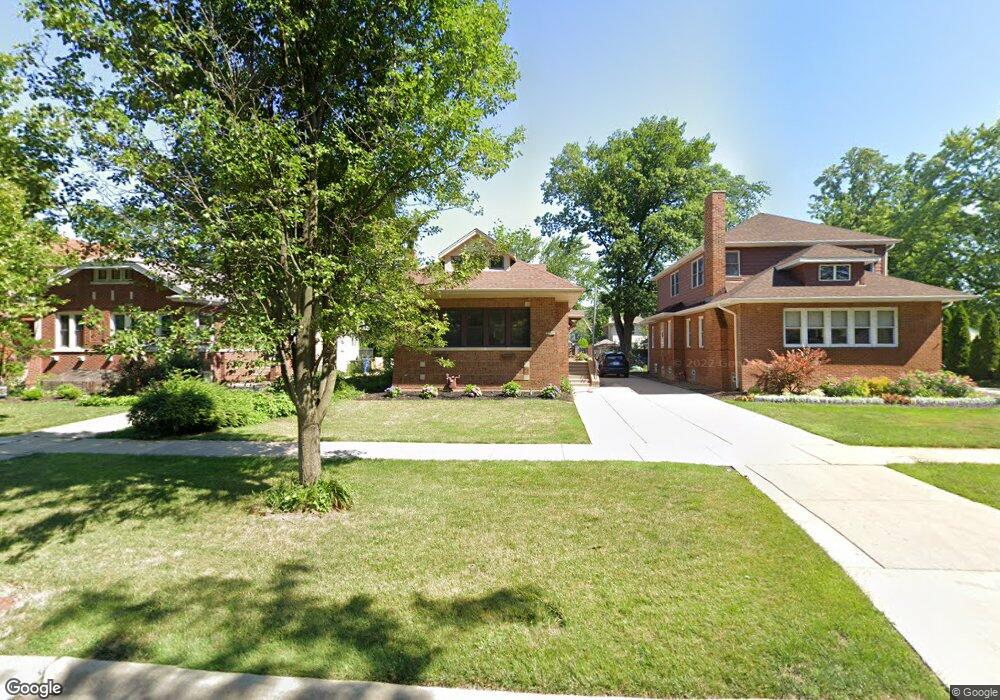
2142 W 108th Place Chicago, IL 60643
Morgan Park NeighborhoodEstimated Value: $517,000 - $722,000
4
Beds
3
Baths
2,400
Sq Ft
$245/Sq Ft
Est. Value
About This Home
This home is located at 2142 W 108th Place, Chicago, IL 60643 and is currently estimated at $587,203, approximately $244 per square foot. 2142 W 108th Place is a home located in Cook County with nearby schools including Clissold Elementary School, Morgan Park High School, and CICS - Longwood Campus.
Ownership History
Date
Name
Owned For
Owner Type
Purchase Details
Closed on
Oct 3, 2019
Sold by
Winters Vincent and Winters Catherine
Bought by
Castle Whitney K and Drew Cass M
Current Estimated Value
Home Financials for this Owner
Home Financials are based on the most recent Mortgage that was taken out on this home.
Original Mortgage
$425,000
Outstanding Balance
$379,569
Interest Rate
4.5%
Mortgage Type
New Conventional
Estimated Equity
$207,634
Purchase Details
Closed on
Mar 1, 2005
Sold by
Reger Phillip and Finn Patrick
Bought by
Winters Vincent and Winters Catherine
Home Financials for this Owner
Home Financials are based on the most recent Mortgage that was taken out on this home.
Original Mortgage
$244,000
Interest Rate
5.67%
Mortgage Type
Unknown
Purchase Details
Closed on
Oct 6, 2004
Sold by
Chicago Title Land Trust Co
Bought by
Regar Phillip and Finn Patrick
Create a Home Valuation Report for This Property
The Home Valuation Report is an in-depth analysis detailing your home's value as well as a comparison with similar homes in the area
Home Values in the Area
Average Home Value in this Area
Purchase History
| Date | Buyer | Sale Price | Title Company |
|---|---|---|---|
| Castle Whitney K | $425,000 | Attorney | |
| Winters Vincent | $305,000 | Stewart Title Of Illinois | |
| Regar Phillip | $240,000 | -- |
Source: Public Records
Mortgage History
| Date | Status | Borrower | Loan Amount |
|---|---|---|---|
| Open | Castle Whitney K | $425,000 | |
| Previous Owner | Winters Vincent | $244,000 | |
| Closed | Winters Vincent | $61,000 |
Source: Public Records
Tax History Compared to Growth
Tax History
| Year | Tax Paid | Tax Assessment Tax Assessment Total Assessment is a certain percentage of the fair market value that is determined by local assessors to be the total taxable value of land and additions on the property. | Land | Improvement |
|---|---|---|---|---|
| 2024 | $8,235 | $44,000 | $10,800 | $33,200 |
| 2023 | $9,283 | $38,936 | $8,550 | $30,386 |
| 2022 | $9,283 | $45,000 | $8,550 | $36,450 |
| 2021 | $9,075 | $45,000 | $8,550 | $36,450 |
| 2020 | $7,089 | $31,744 | $8,550 | $23,194 |
| 2019 | $6,201 | $34,211 | $8,550 | $25,661 |
| 2018 | $6,094 | $34,211 | $8,550 | $25,661 |
| 2017 | $6,990 | $35,774 | $7,650 | $28,124 |
| 2016 | $6,681 | $35,774 | $7,650 | $28,124 |
| 2015 | $6,090 | $35,774 | $7,650 | $28,124 |
| 2014 | $5,169 | $30,358 | $7,200 | $23,158 |
| 2013 | $5,055 | $30,358 | $7,200 | $23,158 |
Source: Public Records
Map
Nearby Homes
- 2023 W 108th Place
- 10905 S Longwood Dr Unit 3
- 2335 W 107th St
- 1918 W 108th Place
- 1914 W 108th Place
- 10628 S Longwood Dr
- 10606 S Longwood Dr
- 10640 S Walden Pkwy
- 1863 W 107th St Unit E
- 2022 W 111th St Unit 1S
- 2012 W 111th St Unit 3S
- 2014 W 111th St Unit 2N
- 2215 W 111th St Unit 101
- 2336 W 111th St Unit 2
- 2348 W 111th St Unit 3
- 10601 S Hale Ave
- 10829 S Maplewood Ave
- 10537 S Hale Ave Unit 1W
- 11017 S Campbell Ave
- 2518 W 109th Place
- 2136 W 108th Place
- 2146 W 108th Place
- 2148 W 108th Place
- 2132 W 108th Place
- 2154 W 108th Place
- 2128 W 108th Place
- 2158 W 108th Place
- 2137 W 107th Place
- 2133 W 107th Place
- 2143 W 107th Place
- 2122 W 108th Place
- 10849 S Bell Ave
- 2129 W 107th Place
- 2149 W 107th Place
- 2123 W 107th Place
- 10855 S Bell Ave
- 2116 W 108th Place
- 2119 W 107th Place
- 2137 W 108th Place
- 10857 S Bell Ave