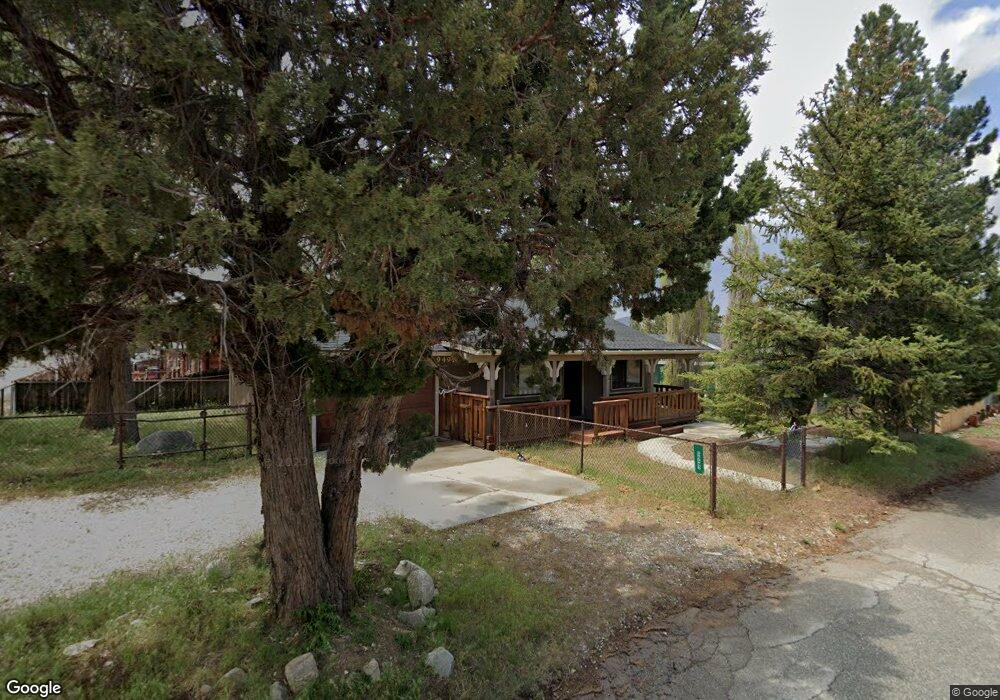
2143 2nd Ln Big Bear City, CA 92314
Estimated Value: $308,925 - $330,000
2
Beds
2
Baths
952
Sq Ft
$336/Sq Ft
Est. Value
About This Home
This home is located at 2143 2nd Ln, Big Bear City, CA 92314 and is currently estimated at $319,481, approximately $335 per square foot. 2143 2nd Ln is a home located in San Bernardino County with nearby schools including Baldwin Lane Elementary School, Big Bear Middle School, and Big Bear High School.
Ownership History
Date
Name
Owned For
Owner Type
Purchase Details
Closed on
Aug 22, 2012
Sold by
Reid Karen L
Bought by
Johnson Rodger W and Johnson Carol S
Current Estimated Value
Purchase Details
Closed on
Jul 24, 1997
Sold by
Hud
Bought by
Johnson Karen L
Purchase Details
Closed on
Mar 19, 1997
Sold by
Petra Herrera
Bought by
Countrywide Home Loans Inc
Purchase Details
Closed on
Feb 18, 1997
Sold by
Countrywide Home Loans Inc
Bought by
Hud
Purchase Details
Closed on
Nov 12, 1993
Sold by
Herrera Petra
Bought by
Herrera Petra
Create a Home Valuation Report for This Property
The Home Valuation Report is an in-depth analysis detailing your home's value as well as a comparison with similar homes in the area
Home Values in the Area
Average Home Value in this Area
Purchase History
| Date | Buyer | Sale Price | Title Company |
|---|---|---|---|
| Johnson Rodger W | $100,000 | Chicago Title | |
| Johnson Karen L | $60,000 | American Title | |
| Countrywide Home Loans Inc | $84,013 | Landsafe Title | |
| Hud | -- | Landsafe Title | |
| Herrera Petra | -- | First American Title Insuran |
Source: Public Records
Tax History Compared to Growth
Tax History
| Year | Tax Paid | Tax Assessment Tax Assessment Total Assessment is a certain percentage of the fair market value that is determined by local assessors to be the total taxable value of land and additions on the property. | Land | Improvement |
|---|---|---|---|---|
| 2025 | $2,462 | $123,143 | $24,628 | $98,515 |
| 2024 | $2,462 | $120,728 | $24,145 | $96,583 |
| 2023 | $2,370 | $118,361 | $23,672 | $94,689 |
| 2022 | $2,265 | $116,040 | $23,208 | $92,832 |
| 2021 | $2,210 | $113,765 | $22,753 | $91,012 |
| 2020 | $2,198 | $112,599 | $22,520 | $90,079 |
| 2019 | $2,148 | $110,391 | $22,078 | $88,313 |
| 2018 | $2,064 | $108,226 | $21,645 | $86,581 |
| 2017 | $2,004 | $106,104 | $21,221 | $84,883 |
| 2016 | $1,952 | $104,024 | $20,805 | $83,219 |
| 2015 | $1,917 | $102,461 | $20,492 | $81,969 |
| 2014 | $1,879 | $100,454 | $20,091 | $80,363 |
Source: Public Records
Map
Nearby Homes