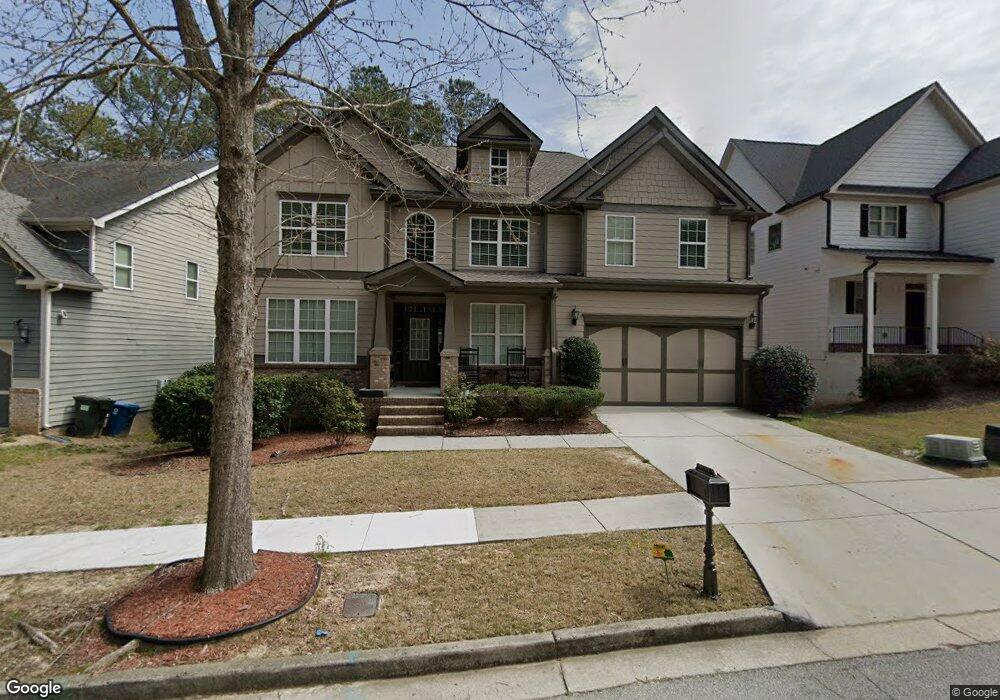
2143 Leafmore Ct Unit 27 Grayson, GA 30017
Estimated Value: $512,869 - $553,000
5
Beds
5
Baths
3,537
Sq Ft
$148/Sq Ft
Est. Value
About This Home
This home is located at 2143 Leafmore Ct Unit 27, Grayson, GA 30017 and is currently estimated at $525,217, approximately $148 per square foot. 2143 Leafmore Ct Unit 27 is a home located in Gwinnett County with nearby schools including W.J. Cooper Elementary School, McConnell Middle School, and Archer High School.
Ownership History
Date
Name
Owned For
Owner Type
Purchase Details
Closed on
Nov 13, 2020
Sold by
Reeves Andrew Stewart
Bought by
Strickland William Kalvin and Strickland Renita Roychelle
Current Estimated Value
Home Financials for this Owner
Home Financials are based on the most recent Mortgage that was taken out on this home.
Original Mortgage
$343,660
Outstanding Balance
$302,406
Interest Rate
2.8%
Mortgage Type
FHA
Estimated Equity
$222,811
Purchase Details
Closed on
Feb 24, 2015
Sold by
Heard Kristin F
Bought by
Reeves Andrew Stewart and Reeves Tracie Leeanne
Home Financials for this Owner
Home Financials are based on the most recent Mortgage that was taken out on this home.
Original Mortgage
$242,526
Interest Rate
4.4%
Mortgage Type
FHA
Purchase Details
Closed on
Jul 30, 2009
Sold by
Decatur Properties Inc
Bought by
Heard David M and Heard Kristin F
Home Financials for this Owner
Home Financials are based on the most recent Mortgage that was taken out on this home.
Original Mortgage
$213,675
Interest Rate
5.37%
Mortgage Type
FHA
Create a Home Valuation Report for This Property
The Home Valuation Report is an in-depth analysis detailing your home's value as well as a comparison with similar homes in the area
Home Values in the Area
Average Home Value in this Area
Purchase History
| Date | Buyer | Sale Price | Title Company |
|---|---|---|---|
| Strickland William Kalvin | $350,000 | -- | |
| Reeves Andrew Stewart | $247,000 | -- | |
| Heard David M | $229,000 | -- |
Source: Public Records
Mortgage History
| Date | Status | Borrower | Loan Amount |
|---|---|---|---|
| Open | Strickland William Kalvin | $343,660 | |
| Previous Owner | Reeves Andrew Stewart | $242,526 | |
| Previous Owner | Heard David M | $213,675 |
Source: Public Records
Tax History
| Year | Tax Paid | Tax Assessment Tax Assessment Total Assessment is a certain percentage of the fair market value that is determined by local assessors to be the total taxable value of land and additions on the property. | Land | Improvement |
|---|---|---|---|---|
| 2025 | $6,795 | $235,960 | $30,000 | $205,960 |
| 2024 | $6,648 | $220,760 | $30,000 | $190,760 |
| 2023 | $6,648 | $204,280 | $34,000 | $170,280 |
| 2022 | $5,986 | $190,200 | $31,600 | $158,600 |
| 2021 | $4,986 | $138,880 | $23,200 | $115,680 |
| 2020 | $4,388 | $131,000 | $20,800 | $110,200 |
| 2019 | $4,257 | $131,000 | $20,800 | $110,200 |
| 2018 | $3,961 | $117,000 | $20,800 | $96,200 |
| 2016 | $3,587 | $98,800 | $16,400 | $82,400 |
| 2015 | $3,864 | $99,720 | $12,000 | $87,720 |
| 2014 | -- | $99,720 | $12,000 | $87,720 |
Source: Public Records
Map
Nearby Homes
- 1478 High Falls Ln
- 1458 High Falls Ln
- 1488 High Falls Ln
- 1498 High Falls Ln
- 1518 High Falls Ln
- 1499 High Falls Ln
- 1489 High Falls Ln
- 1428 High Falls Ln
- 401 Tallulah Ln
- 411 Tallulah Ln
- 391 Tallulah Ln
- 471 Tallulah Ln
- 486 Tallulah Ln
- 1408 High Falls Ln
- 416 Tallulah Ln
- 406 Tallulah Ln
- 496 Tallulah Ln
- 213 Soseby Lake Ln
- 516 Tallulah Ln
- 203 Soseby Lake Ln
- 2143 Leafmore Ct
- 2133 Leafmore Ct Unit 26
- 2133 Leafmore Ct
- 2153 Leafmore Ct
- 2133 Leafmore Ct SE
- 2163 Leafmore Ct
- 2103 Leafmore Ct Unit 25
- 2103 Leafmore Ct
- 2103 Leafmore Ct SE
- 2136 Leafmore Ct
- 2093 Leafmore Ct
- 2126 Leafmore Ct
- 2083 Leafmore Ct SE
- 2083 Leafmore Ct
- 2116 Leafmore Ct
- 2116 Leafmore Ct SE
- 2106 Leafmore Ct
- 2096 Leafmore Ct
- 2073 Leafmore Ct
- 2086 Leafmore Ct SE
Your Personal Tour Guide
Ask me questions while you tour the home.