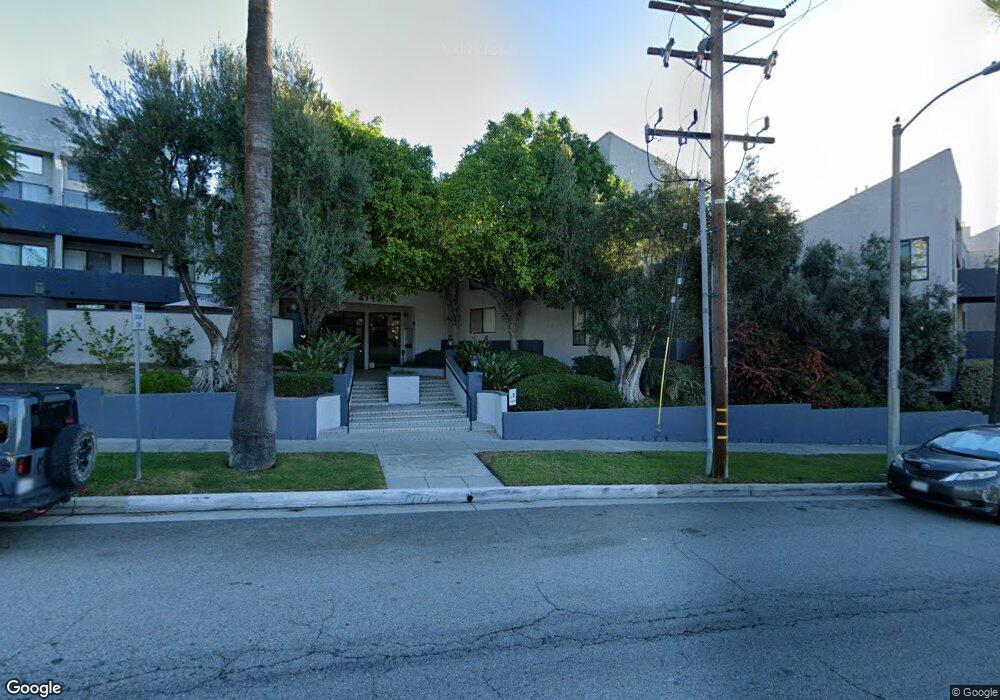
2143 Montrose Ave Unit 108 Montrose, CA 91020
Montecito Park NeighborhoodEstimated Value: $681,834 - $747,000
2
Beds
2
Baths
1,161
Sq Ft
$618/Sq Ft
Est. Value
About This Home
This home is located at 2143 Montrose Ave Unit 108, Montrose, CA 91020 and is currently estimated at $717,709, approximately $618 per square foot. 2143 Montrose Ave Unit 108 is a home located in Los Angeles County with nearby schools including John C. Fremont Elementary School, Rosemont Middle School, and Crescenta Valley High School.
Ownership History
Date
Name
Owned For
Owner Type
Purchase Details
Closed on
Oct 1, 2007
Sold by
Markss Joel A and Markss Elinor A
Bought by
Joel A & Elinor Ann Markss Ab Living Tr
Current Estimated Value
Purchase Details
Closed on
Aug 10, 2004
Sold by
Debenedet Albert and Debenedet Theresa
Bought by
Markss Joel A and Markss Elinor A
Create a Home Valuation Report for This Property
The Home Valuation Report is an in-depth analysis detailing your home's value as well as a comparison with similar homes in the area
Home Values in the Area
Average Home Value in this Area
Purchase History
| Date | Buyer | Sale Price | Title Company |
|---|---|---|---|
| Joel A & Elinor Ann Markss Ab Living Tr | -- | None Available | |
| Markss Joel A | -- | Chicago Title Company |
Source: Public Records
Tax History Compared to Growth
Tax History
| Year | Tax Paid | Tax Assessment Tax Assessment Total Assessment is a certain percentage of the fair market value that is determined by local assessors to be the total taxable value of land and additions on the property. | Land | Improvement |
|---|---|---|---|---|
| 2025 | $5,646 | $501,787 | $363,522 | $138,265 |
| 2024 | $5,646 | $491,949 | $356,395 | $135,554 |
| 2023 | $5,519 | $482,304 | $349,407 | $132,897 |
| 2022 | $5,387 | $472,848 | $342,556 | $130,292 |
| 2021 | $5,293 | $463,578 | $335,840 | $127,738 |
| 2019 | $5,091 | $449,830 | $325,880 | $123,950 |
| 2018 | $5,008 | $441,011 | $319,491 | $121,520 |
| 2016 | $4,442 | $393,000 | $284,700 | $108,300 |
| 2015 | $4,407 | $393,000 | $284,700 | $108,300 |
| 2014 | $4,456 | $393,000 | $284,700 | $108,300 |
Source: Public Records
Map
Nearby Homes
- 2222 Montrose Ave Unit G
- 2249 Montrose Ave Unit 7
- 2048 Valderas Dr
- 4430 Rosebank Dr
- 2102 La Canada Crest Dr Unit B
- 3470 Downing Ave
- 3658 Sierra Vista Ave
- 3508 Rosemary Ave
- 2468 Montrose Ave Unit 6
- 4326 Briggs Ave
- 3328 N Verdugo Rd
- 2522 Fairway Ave
- 2434 Prospect Ave
- 4467 Ardara Place
- 4328 Sunset Ave
- 4639 El Camino Corto
- 4644 Hillard Ave
- 3226 Menlo Dr
- 1929 Lyans Dr
- 2512 Prospect Ave
- 2143 Montrose Ave
- 2143 Montrose Ave Unit 200
- 2143 Montrose Ave Unit 107
- 2143 Montrose Ave Unit 105
- 2143 Montrose Ave Unit 104
- 2143 Montrose Ave Unit 102
- 2143 Montrose Ave Unit 101
- 2143 Montrose Ave Unit 309
- 2143 Montrose Ave Unit 300
- 2143 Montrose Ave Unit 214
- 2143 Montrose Ave Unit 213
- 2143 Montrose Ave Unit 212
- 2143 Montrose Ave Unit 211
- 2143 Montrose Ave Unit 210
- 2143 Montrose Ave Unit 209
- 2143 Montrose Ave Unit 208
- 2143 Montrose Ave Unit 207
- 2143 Montrose Ave Unit 206
- 2143 Montrose Ave Unit 205
- 2143 Montrose Ave Unit 204