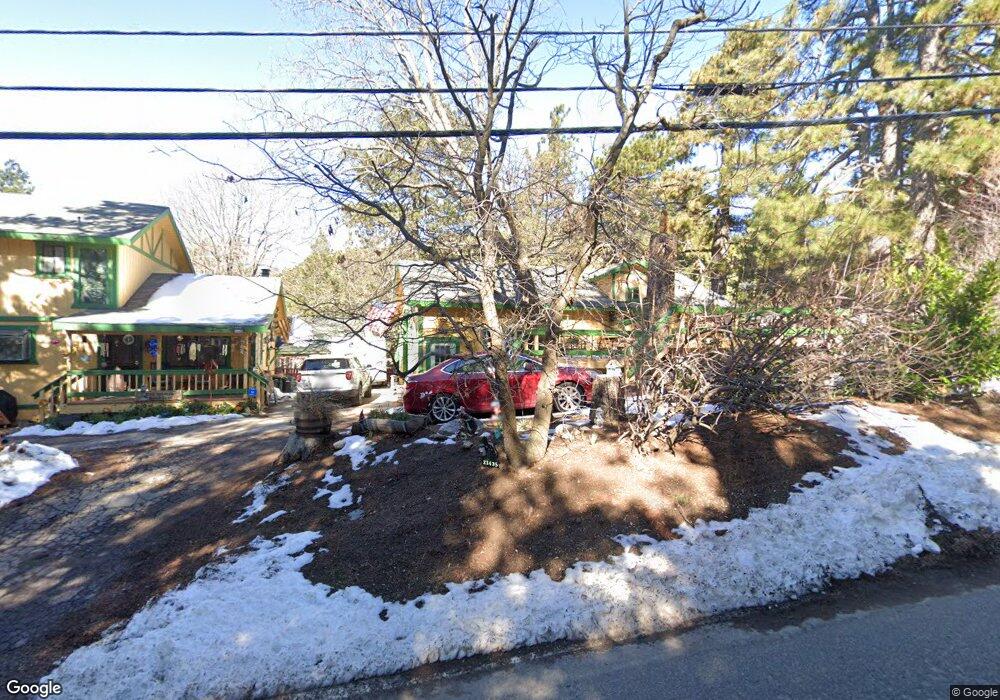
21435 Crest Forest Dr Crestline, CA 92325
Estimated Value: $300,000 - $347,000
2
Beds
2
Baths
1,218
Sq Ft
$268/Sq Ft
Est. Value
About This Home
This home is located at 21435 Crest Forest Dr, Crestline, CA 92325 and is currently estimated at $326,954, approximately $268 per square foot. 21435 Crest Forest Dr is a home with nearby schools including Valley Of Enchantment Elementary School, Mary P. Henck Intermediate School, and Rim Of The World Senior High School.
Ownership History
Date
Name
Owned For
Owner Type
Purchase Details
Closed on
Jul 1, 1998
Sold by
Labounty Gary O
Bought by
White Karl Robert
Current Estimated Value
Home Financials for this Owner
Home Financials are based on the most recent Mortgage that was taken out on this home.
Original Mortgage
$94,720
Outstanding Balance
$19,216
Interest Rate
6.9%
Mortgage Type
FHA
Estimated Equity
$307,738
Purchase Details
Closed on
Jun 26, 1998
Sold by
Labounty Gary O
Bought by
White Karl Robert
Home Financials for this Owner
Home Financials are based on the most recent Mortgage that was taken out on this home.
Original Mortgage
$94,720
Outstanding Balance
$19,216
Interest Rate
6.9%
Mortgage Type
FHA
Estimated Equity
$307,738
Purchase Details
Closed on
Nov 7, 1996
Sold by
Labounty Gary O
Bought by
Labounty Gary O and The Gary O Labounty Trust
Create a Home Valuation Report for This Property
The Home Valuation Report is an in-depth analysis detailing your home's value as well as a comparison with similar homes in the area
Home Values in the Area
Average Home Value in this Area
Purchase History
We collect this data history from publicly available records. To have your information removed, we recommend requesting removal directly through your county’s website.
| Date | Buyer | Sale Price | Title Company |
|---|---|---|---|
| White Karl Robert | $95,000 | Commonwealth Land Title Co | |
| White Karl Robert | -- | Commonwealth Land Title Co | |
| Labounty Gary O | -- | Commonwealth Land Title Co | |
| Labounty Gary O | -- | -- |
Source: Public Records
Mortgage History
We collect this data history from publicly available records. To have your information removed, we recommend requesting removal directly through your county’s website.
| Date | Status | Borrower | Loan Amount |
|---|---|---|---|
| Open | White Karl Robert | $94,720 |
Source: Public Records
Tax History
| Year | Tax Paid | Tax Assessment Tax Assessment Total Assessment is a certain percentage of the fair market value that is determined by local assessors to be the total taxable value of land and additions on the property. | Land | Improvement |
|---|---|---|---|---|
| 2025 | $2,756 | $203,814 | $27,437 | $176,377 |
| 2024 | $2,660 | $199,818 | $26,899 | $172,919 |
| 2023 | $2,626 | $195,900 | $26,372 | $169,528 |
| 2022 | $2,573 | $192,059 | $25,855 | $166,204 |
| 2021 | $2,542 | $188,293 | $25,348 | $162,945 |
| 2020 | $2,537 | $186,362 | $25,088 | $161,274 |
| 2019 | $2,477 | $182,708 | $24,596 | $158,112 |
| 2018 | $2,228 | $179,126 | $24,114 | $155,012 |
| 2017 | $2,188 | $175,614 | $23,641 | $151,973 |
| 2016 | $2,121 | $172,170 | $23,177 | $148,993 |
| 2015 | $2,098 | $169,584 | $22,829 | $146,755 |
| 2014 | $2,318 | $166,262 | $22,382 | $143,880 |
Source: Public Records
Map
Nearby Homes
- 19 Tower Heights Rd
- 783 Tower Heights Rd
- 21818 Vista Rd
- 1 Tower Heights Rd
- 21875 Sawpit Canyon Rd
- 402 Burnt Mill Canyon Rd
- 0 Elliot Rd Unit IG24080271
- 22070 Big Oak Rd
- Lot 78 Cedar Pines Dr
- 21858 Fern Canyon Rd
- 21854 Whispering Pines Dr
- 47 El Valle Rd
- 0 El Valle Rd Unit IV26022377
- 756 Mojave River (Near) Rd
- 26 Peak Cir
- 0 Running Springs Ln
- 355 Hartman Cir
- 20 Burnt Mill Canyon Rd
- 21636 Sawpit Canyon Rd
- 21621 Sawpit Canyon Rd
- 21848 Sawpit Canyon Rd
- 21425 Crest Forest Dr
- 21441 Crest Forest Dr
- 21417 Crest Forest Dr
- 21441 Crest Forest Dr
- 21417 Crest Forest Dr
- 21440 Crest Forest Dr
- 21424 Crest Forest Dr
- 21846 Sawpit Canyon Rd
- 21859 Sawpit Canyon Rd
- 21850 Sawpit Canyon Rd
- 227 Mojave River Dr
- 21871 Sawpit Canyon Rd
- 21919 Mojave River Rd
- 21837 Sawpit Canyon Rd
- 21450 Crest Forest Dr
- 21849 Sawpit Canyon Rd
- 21927 Tower Heights Rd
- 319 Mozumdar Dr
- 21931 Mojave River Rd
Your Personal Tour Guide
Ask me questions while you tour the home.