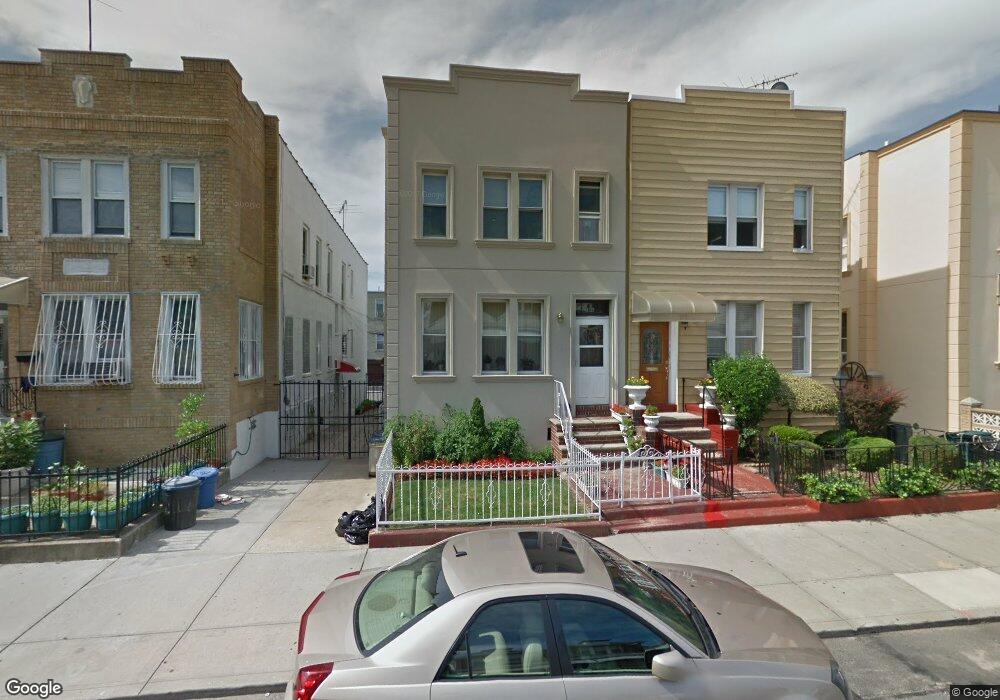
2144 61st St Brooklyn, NY 11204
Mapleton NeighborhoodEstimated Value: $1,996,000 - $2,216,776
--
Bed
--
Bath
3,400
Sq Ft
$612/Sq Ft
Est. Value
About This Home
This home is located at 2144 61st St, Brooklyn, NY 11204 and is currently estimated at $2,081,444, approximately $612 per square foot. 2144 61st St is a home located in Kings County with nearby schools including P.S. 226 Alfred De B. Mason, P.S. 121 Nelson A Rockefeller, and Franklin Delano Roosevelt High School.
Ownership History
Date
Name
Owned For
Owner Type
Purchase Details
Closed on
Jul 12, 2022
Sold by
Gutman Esther
Bought by
Piller Bernard and Piller Tova G
Current Estimated Value
Purchase Details
Closed on
Jun 3, 2021
Sold by
Gutman Esther
Bought by
Gutman Esther and Gutman, Yehuda
Home Financials for this Owner
Home Financials are based on the most recent Mortgage that was taken out on this home.
Original Mortgage
$1,243,050
Interest Rate
4.72%
Mortgage Type
Purchase Money Mortgage
Purchase Details
Closed on
Dec 20, 2012
Sold by
Alberti Angelo R
Bought by
Gutman Esther and Gutman Yehudah
Home Financials for this Owner
Home Financials are based on the most recent Mortgage that was taken out on this home.
Original Mortgage
$533,850
Interest Rate
3.36%
Mortgage Type
New Conventional
Purchase Details
Closed on
Jun 22, 2012
Sold by
Alberti Roy P
Bought by
Alberti Angelo R and Alberti Charles R
Create a Home Valuation Report for This Property
The Home Valuation Report is an in-depth analysis detailing your home's value as well as a comparison with similar homes in the area
Home Values in the Area
Average Home Value in this Area
Purchase History
| Date | Buyer | Sale Price | Title Company |
|---|---|---|---|
| Piller Bernard | -- | -- | |
| Gutman Esther | -- | -- | |
| Gutman Esther | $840,000 | -- | |
| Alberti Angelo R | -- | -- |
Source: Public Records
Mortgage History
| Date | Status | Borrower | Loan Amount |
|---|---|---|---|
| Previous Owner | Gutman Esther | $1,243,050 | |
| Previous Owner | Gutman Esther | $533,850 |
Source: Public Records
Tax History Compared to Growth
Tax History
| Year | Tax Paid | Tax Assessment Tax Assessment Total Assessment is a certain percentage of the fair market value that is determined by local assessors to be the total taxable value of land and additions on the property. | Land | Improvement |
|---|---|---|---|---|
| 2025 | $10,795 | $118,620 | $23,880 | $94,740 |
| 2024 | $10,795 | $113,400 | $23,880 | $89,520 |
| 2023 | $10,565 | $113,700 | $23,880 | $89,820 |
| 2022 | $9,871 | $112,020 | $23,880 | $88,140 |
| 2021 | $9,991 | $95,760 | $23,880 | $71,880 |
| 2020 | $2,306 | $96,300 | $23,880 | $72,420 |
| 2019 | $9,369 | $80,940 | $23,880 | $57,060 |
| 2018 | $8,837 | $43,352 | $10,969 | $32,383 |
| 2017 | $8,400 | $41,205 | $13,257 | $27,948 |
| 2016 | $7,909 | $39,563 | $15,362 | $24,201 |
| 2015 | $4,469 | $37,324 | $15,375 | $21,949 |
| 2014 | $4,469 | $37,324 | $17,274 | $20,050 |
Source: Public Records
Map
Nearby Homes