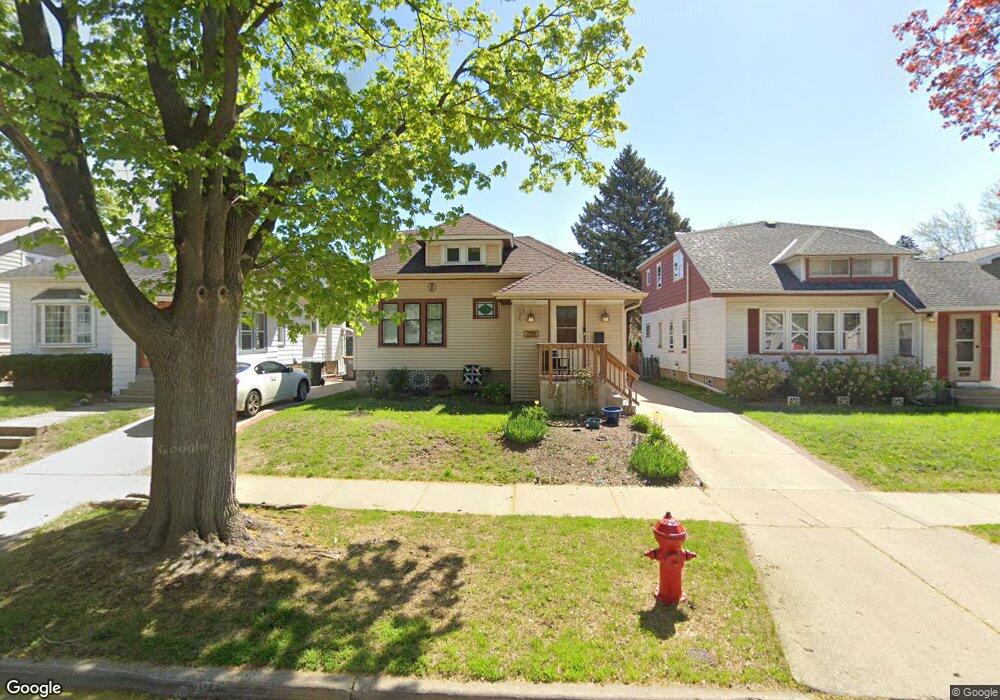
2144 N 66th St Milwaukee, WI 53213
Estimated Value: $415,465 - $456,000
3
Beds
1
Bath
1,338
Sq Ft
$329/Sq Ft
Est. Value
About This Home
This home is located at 2144 N 66th St, Milwaukee, WI 53213 and is currently estimated at $439,866, approximately $328 per square foot. 2144 N 66th St is a home located in Milwaukee County with nearby schools including Washington Elementary School, Longfellow Middle School, and East High School.
Ownership History
Date
Name
Owned For
Owner Type
Purchase Details
Closed on
Jan 16, 2021
Sold by
Franzesch Hailey
Bought by
Franzesch Hailey and Haiely Franzesch 2021 Rev Tr
Current Estimated Value
Purchase Details
Closed on
Feb 15, 2017
Sold by
Rankin Amy B and Mager Amy
Bought by
Frangesch Hailey
Purchase Details
Closed on
Jul 31, 2014
Sold by
Higbee Thomas A
Bought by
Rankin Amy B
Home Financials for this Owner
Home Financials are based on the most recent Mortgage that was taken out on this home.
Original Mortgage
$190,800
Interest Rate
4.11%
Purchase Details
Closed on
Sep 25, 2001
Sold by
Schilling James D
Bought by
Nichols Caroline J
Home Financials for this Owner
Home Financials are based on the most recent Mortgage that was taken out on this home.
Original Mortgage
$94,000
Interest Rate
6.88%
Create a Home Valuation Report for This Property
The Home Valuation Report is an in-depth analysis detailing your home's value as well as a comparison with similar homes in the area
Home Values in the Area
Average Home Value in this Area
Purchase History
| Date | Buyer | Sale Price | Title Company |
|---|---|---|---|
| Franzesch Hailey | -- | None Available | |
| Frangesch Hailey | $247,000 | None Available | |
| Rankin Amy B | $212,000 | None Available | |
| Nichols Caroline J | $58,900 | -- | |
| Nichols Caroline J | $58,900 | -- |
Source: Public Records
Mortgage History
| Date | Status | Borrower | Loan Amount |
|---|---|---|---|
| Previous Owner | Rankin Amy B | $190,800 | |
| Previous Owner | Nichols Caroline J | $94,000 |
Source: Public Records
Tax History Compared to Growth
Tax History
| Year | Tax Paid | Tax Assessment Tax Assessment Total Assessment is a certain percentage of the fair market value that is determined by local assessors to be the total taxable value of land and additions on the property. | Land | Improvement |
|---|---|---|---|---|
| 2024 | $6,510 | $271,300 | $85,200 | $186,100 |
| 2023 | $5,747 | $271,300 | $85,200 | $186,100 |
| 2022 | $5,853 | $271,300 | $85,200 | $186,100 |
| 2021 | $5,598 | $271,300 | $85,200 | $186,100 |
| 2020 | $6,086 | $271,300 | $85,200 | $186,100 |
| 2019 | $5,583 | $252,100 | $85,200 | $166,900 |
| 2018 | $4,182 | $178,200 | $84,800 | $93,400 |
| 2017 | $4,164 | $178,200 | $84,800 | $93,400 |
| 2016 | $4,164 | $178,200 | $84,800 | $93,400 |
| 2015 | $4,103 | $178,200 | $84,800 | $93,400 |
| 2014 | $4,114 | $178,200 | $84,800 | $93,400 |
| 2013 | $4,170 | $178,200 | $84,800 | $93,400 |
Source: Public Records
Map
Nearby Homes
- 2107 N 66th St Unit 2109
- 6304 Upper Pkwy N
- 2344 N 68th St
- 2149 N 60th St
- 6908 Hillcrest Dr
- 6000 W Lloyd St
- 2229 N 70th St
- 1651 Alta Vista Ave
- 7026 W North Ave
- 2430 N 63rd St
- 2312 N 71st St
- 2337 N 71st St
- 2002 N 58th St
- 2538 N 66th St
- 1753 N 58th St
- 2338 N 58th St
- 1443 N 65th St
- 6830 Kinsman St
- 1543 N 60th St
- 1847 N 56th St
- 2150 N 66th St
- 2138 N 66th St
- 2156 N 66th St
- 2134 N 66th St
- 2162 N 66th St
- 2128 N 66th St
- 2147 N 65th St
- 2143 N 65th St
- 2153 N 65th St
- 2126 N 66th St
- 2168 N 66th St
- 2137 N 65th St Unit 2139
- 2157 N 65th St
- 2157 N 65th St Unit 2159
- 2131 N 65th St
- 2165 N 65th St
- 2165 N 65th St Unit 2165 N. 65 Street
- 2120 N 66th St
- 2172 N 66th St
- 2145 N 66th St