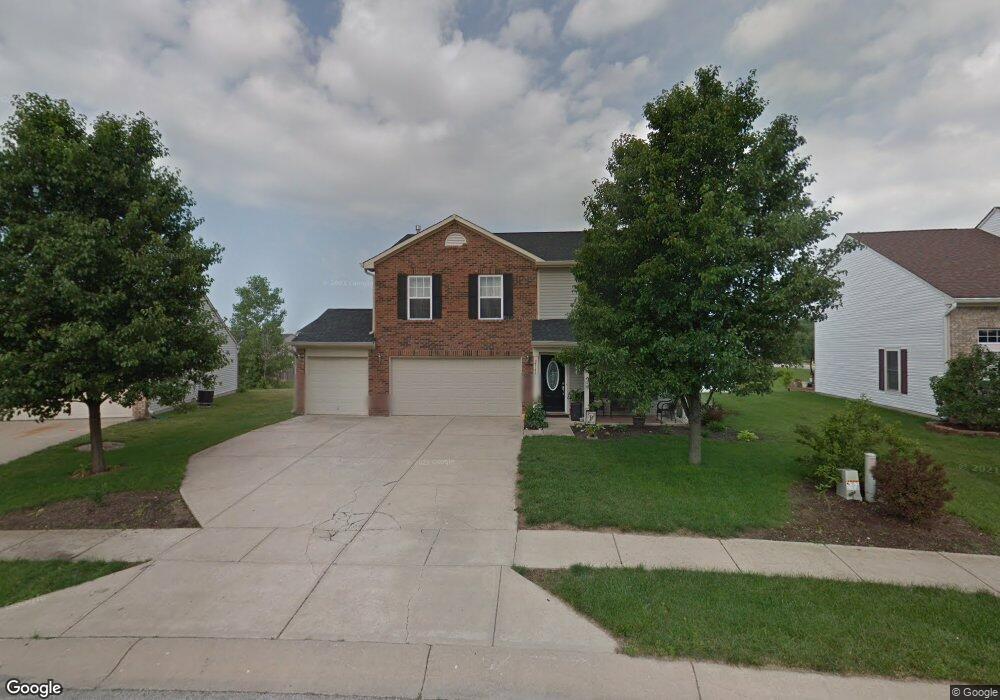
2144 Turning Leaf Dr Franklin, IN 46131
Estimated Value: $282,165 - $320,000
4
Beds
3
Baths
2,049
Sq Ft
$146/Sq Ft
Est. Value
About This Home
This home is located at 2144 Turning Leaf Dr, Franklin, IN 46131 and is currently estimated at $298,291, approximately $145 per square foot. 2144 Turning Leaf Dr is a home located in Johnson County with nearby schools including Northwood Elementary School, Franklin Community Middle School, and Custer Baker Intermediate School.
Ownership History
Date
Name
Owned For
Owner Type
Purchase Details
Closed on
Sep 6, 2013
Sold by
Bopp Peter Mathew
Bought by
Parker Che and Parker Michelle
Current Estimated Value
Purchase Details
Closed on
Dec 8, 2011
Sold by
Bopp Peter Matthew and Bopp Peter Mathew
Bought by
Parker Allen and Parker Michelle
Home Financials for this Owner
Home Financials are based on the most recent Mortgage that was taken out on this home.
Original Mortgage
$135,000
Interest Rate
7%
Mortgage Type
Seller Take Back
Purchase Details
Closed on
Jun 25, 2009
Sold by
Secretary Of Hud
Bought by
Bopp Peter Mathew
Home Financials for this Owner
Home Financials are based on the most recent Mortgage that was taken out on this home.
Original Mortgage
$72,000
Interest Rate
4.37%
Mortgage Type
Adjustable Rate Mortgage/ARM
Purchase Details
Closed on
Feb 18, 2009
Sold by
Countrywide Home Loans Inc
Bought by
Secretary Of Hud
Purchase Details
Closed on
Nov 20, 2008
Sold by
Small Michael E
Bought by
Countrywide Home Loans Inc
Create a Home Valuation Report for This Property
The Home Valuation Report is an in-depth analysis detailing your home's value as well as a comparison with similar homes in the area
Home Values in the Area
Average Home Value in this Area
Purchase History
| Date | Buyer | Sale Price | Title Company |
|---|---|---|---|
| Parker Che | $135,000 | -- | |
| Parker Allen | -- | None Available | |
| Bopp Peter Mathew | -- | None Available | |
| Secretary Of Hud | -- | None Available | |
| Countrywide Home Loans Inc | $165,660 | None Available |
Source: Public Records
Mortgage History
| Date | Status | Borrower | Loan Amount |
|---|---|---|---|
| Previous Owner | Parker Allen | $135,000 | |
| Previous Owner | Bopp Peter Mathew | $72,000 |
Source: Public Records
Tax History
| Year | Tax Paid | Tax Assessment Tax Assessment Total Assessment is a certain percentage of the fair market value that is determined by local assessors to be the total taxable value of land and additions on the property. | Land | Improvement |
|---|---|---|---|---|
| 2025 | $5,298 | $257,500 | $21,400 | $236,100 |
| 2024 | $5,298 | $239,500 | $21,800 | $217,700 |
| 2023 | $5,004 | $224,900 | $21,800 | $203,100 |
| 2022 | $4,857 | $217,800 | $21,800 | $196,000 |
| 2021 | $3,956 | $177,400 | $14,200 | $163,200 |
| 2020 | $1,757 | $159,300 | $14,200 | $145,100 |
| 2019 | $1,688 | $153,300 | $12,400 | $140,900 |
| 2018 | $1,404 | $146,500 | $12,400 | $134,100 |
| 2017 | $1,342 | $134,200 | $12,400 | $121,800 |
| 2016 | $1,291 | $137,000 | $12,400 | $124,600 |
| 2014 | $1,265 | $126,500 | $23,200 | $103,300 |
| 2013 | $1,265 | $127,700 | $23,200 | $104,500 |
Source: Public Records
Map
Nearby Homes
- 1220 Harvest Ridge Cir
- 1194 Grassy Creek Cir
- 2002 Falcon Ct
- 1712 Turning Leaf Dr
- 1985 Falcon Ct
- 1996 Acorn Rd Unit 2000
- 2000 Acorn Rd
- 1664 Woodside Cir
- 1212 Crabapple Rd
- 1225 S Aberdeen Dr
- 1195 S Aberdeen Dr
- 1046 Ebony Cir
- 1408 Crabapple Rd
- 1424 Crabapple Rd
- 1236 N Aberdeen Dr
- 1455 Cecil Ln
- 2638 Fielding Ct
- 1286 Murphy Dr
- 1238 Atlas Ln
- 1860 Churchill Rd
- 2138 Turning Leaf Dr
- 2132 Turning Leaf Dr
- 1205 Yellowstone Way
- 1211 Yellowstone Way
- 1199 Harvest Ridge Cir
- 1201 Yellowstone Way
- 1217 Yellowstone Way
- 2156 Turning Leaf Dr
- 2126 Turning Leaf Dr
- 1223 Yellowstone Way
- 1197 Harvest Ridge Cir
- 1202 Harvest Ridge Cir
- 2120 Turning Leaf Dr
- 2162 Turning Leaf Dr
- 1229 Yellowstone Way
- 1198 Harvest Ridge Cir
- 1187 Harvest Ridge Cir
- 1208 Harvest Ridge Cir
- 1190 Spring Meadow Ct
Your Personal Tour Guide
Ask me questions while you tour the home.