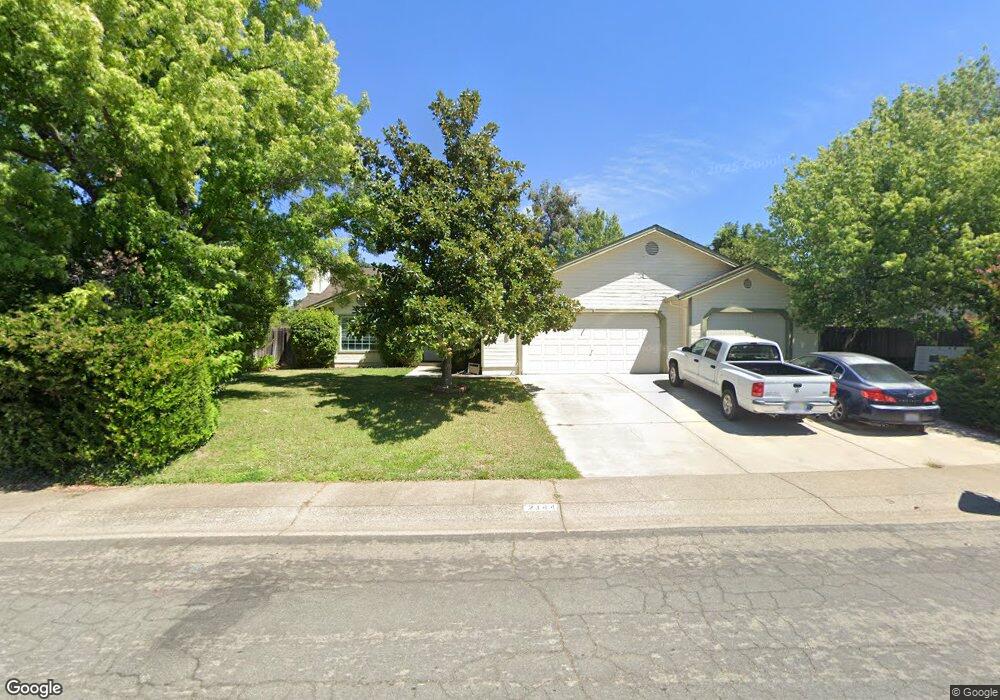
2144 Wicklow St Redding, CA 96001
Mary Lake NeighborhoodEstimated Value: $377,588 - $446,000
4
Beds
2
Baths
1,882
Sq Ft
$225/Sq Ft
Est. Value
About This Home
This home is located at 2144 Wicklow St, Redding, CA 96001 and is currently estimated at $422,897, approximately $224 per square foot. 2144 Wicklow St is a home located in Shasta County with nearby schools including Manzanita Elementary School, Sequoia Middle School, and Shasta High School.
Ownership History
Date
Name
Owned For
Owner Type
Purchase Details
Closed on
Jan 26, 2010
Sold by
Horton Gregory H
Bought by
Roberts Thomas E and Roberts Helen E
Current Estimated Value
Purchase Details
Closed on
Jan 7, 2010
Sold by
Whitehead Irene C
Bought by
Horton Gregory H
Purchase Details
Closed on
Jun 30, 2004
Sold by
Bunting William H and Bunting Mary Jo
Bought by
Whitehead Irene C
Home Financials for this Owner
Home Financials are based on the most recent Mortgage that was taken out on this home.
Original Mortgage
$247,200
Interest Rate
3.68%
Mortgage Type
Purchase Money Mortgage
Purchase Details
Closed on
Nov 18, 2002
Sold by
Borelli Michael J and Borelli Carolyn M
Bought by
Bunting William H and Bunting Mary Jo
Home Financials for this Owner
Home Financials are based on the most recent Mortgage that was taken out on this home.
Original Mortgage
$163,600
Interest Rate
6.28%
Mortgage Type
Purchase Money Mortgage
Create a Home Valuation Report for This Property
The Home Valuation Report is an in-depth analysis detailing your home's value as well as a comparison with similar homes in the area
Home Values in the Area
Average Home Value in this Area
Purchase History
| Date | Buyer | Sale Price | Title Company |
|---|---|---|---|
| Roberts Thomas E | $231,000 | Fidelity Natl Title Co Of Ca | |
| Horton Gregory H | $170,400 | None Available | |
| Whitehead Irene C | $309,000 | First American Title Co | |
| Bunting William H | $204,500 | Placer Title Company |
Source: Public Records
Mortgage History
| Date | Status | Borrower | Loan Amount |
|---|---|---|---|
| Previous Owner | Whitehead Irene C | $247,200 | |
| Previous Owner | Bunting William H | $163,600 |
Source: Public Records
Tax History
| Year | Tax Paid | Tax Assessment Tax Assessment Total Assessment is a certain percentage of the fair market value that is determined by local assessors to be the total taxable value of land and additions on the property. | Land | Improvement |
|---|---|---|---|---|
| 2025 | $3,089 | $298,164 | $70,986 | $227,178 |
| 2024 | $3,042 | $292,319 | $69,595 | $222,724 |
| 2023 | $3,042 | $286,588 | $68,231 | $218,357 |
| 2022 | $2,991 | $280,970 | $66,894 | $214,076 |
| 2021 | $2,977 | $275,462 | $65,583 | $209,879 |
| 2020 | $3,017 | $272,638 | $64,911 | $207,727 |
| 2019 | $2,864 | $267,293 | $63,639 | $203,654 |
| 2018 | $2,890 | $262,053 | $62,392 | $199,661 |
| 2017 | $2,875 | $256,916 | $61,169 | $195,747 |
| 2016 | $2,783 | $251,879 | $59,970 | $191,909 |
| 2015 | $2,748 | $248,097 | $59,070 | $189,027 |
| 2014 | $2,730 | $243,238 | $57,913 | $185,325 |
Source: Public Records
Map
Nearby Homes
- 1783 Record Ln
- 4519 Nantucket Dr
- 1974 Kildare Dr
- 1756 Mary Lake Dr
- 4395 Carlow Way
- 1846 Kildare Dr
- 4746 Tralee Ln
- 4125 Oro St
- 1695 Kildare Dr
- 1692 Kildare Dr
- 4160 Travona Ct
- 4065 Meander Dr
- 16928 Campo Calle
- 1513 Brinn Dr
- 3882 Fujiyama Way
- 0 Thompson Ln
- 2242 Everest Dr
- 4648 Kilkee Dr
- 1426 Gladstone Ct
- 2358 Cumberland Dr
- 2098 Imelda Ct
- 2076 Imelda Ct
- 2188 Wicklow St
- 2177 Wicklow St
- 2155 Wicklow St
- 2075 O'Connor Ave
- 2064 Imelda Ct
- 2199 Wicklow St
- 2087 Imelda Ct
- 2133 Wicklow St
- 2111 Wicklow St
- 2057 O'Conner
- 2057 Oconner Ave
- 9 Wicklow St
- 0 Wicklow St
- 10 Wicklow St
- 2105 Wicklow St
- 2053 Imelda Ct
- 2068 Wicklow St
- 2175 Oconner Ave
Your Personal Tour Guide
Ask me questions while you tour the home.