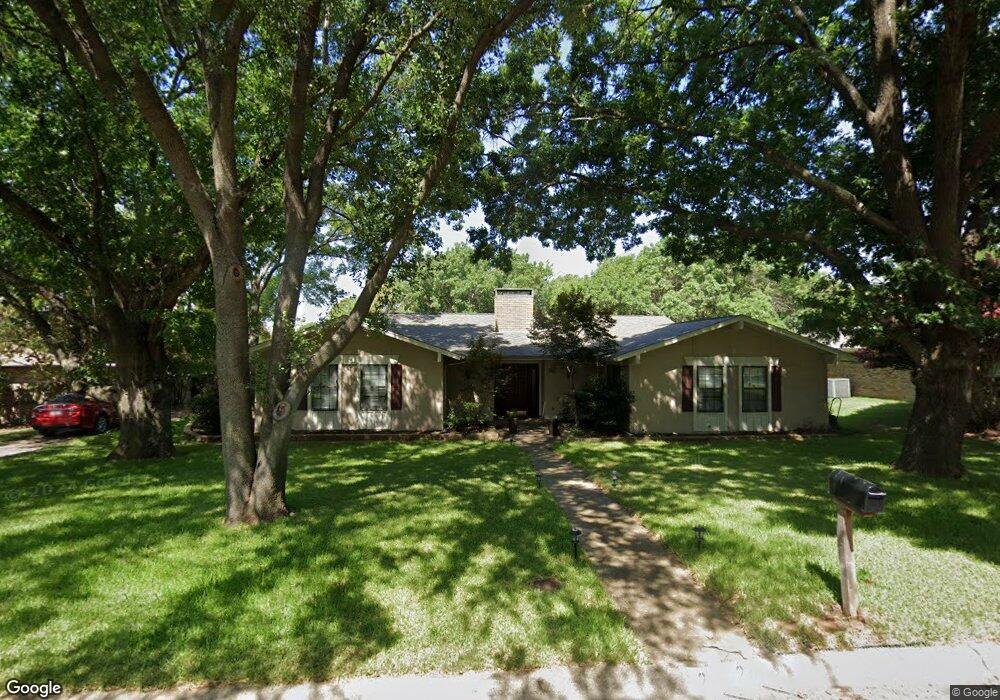
2144 Woodbrook St Denton, TX 76205
South Denton NeighborhoodEstimated Value: $501,000 - $518,000
4
Beds
2
Baths
2,646
Sq Ft
$193/Sq Ft
Est. Value
About This Home
This home is located at 2144 Woodbrook St, Denton, TX 76205 and is currently estimated at $510,930, approximately $193 per square foot. 2144 Woodbrook St is a home located in Denton County with nearby schools including Houston Elementary School, McMath Middle School, and Denton High School.
Ownership History
Date
Name
Owned For
Owner Type
Purchase Details
Closed on
Jul 28, 2017
Sold by
Jud Kyle R and Jud Rachel D
Bought by
Prill Brandon M
Current Estimated Value
Home Financials for this Owner
Home Financials are based on the most recent Mortgage that was taken out on this home.
Original Mortgage
$296,000
Outstanding Balance
$246,655
Interest Rate
3.91%
Mortgage Type
New Conventional
Estimated Equity
$264,275
Purchase Details
Closed on
Oct 30, 2013
Sold by
Finley Thad R and Finley Thad Robert
Bought by
Jud Kyle R and Jud Rachel D
Home Financials for this Owner
Home Financials are based on the most recent Mortgage that was taken out on this home.
Original Mortgage
$191,468
Interest Rate
4.25%
Mortgage Type
FHA
Purchase Details
Closed on
Jul 27, 1995
Sold by
Robinson Charles E
Bought by
Finley Thad R and Finley Jacki
Home Financials for this Owner
Home Financials are based on the most recent Mortgage that was taken out on this home.
Original Mortgage
$117,800
Interest Rate
7.49%
Create a Home Valuation Report for This Property
The Home Valuation Report is an in-depth analysis detailing your home's value as well as a comparison with similar homes in the area
Home Values in the Area
Average Home Value in this Area
Purchase History
| Date | Buyer | Sale Price | Title Company |
|---|---|---|---|
| Prill Brandon M | -- | None Available | |
| Jud Kyle R | -- | Title Resources | |
| Finley Thad R | -- | -- |
Source: Public Records
Mortgage History
| Date | Status | Borrower | Loan Amount |
|---|---|---|---|
| Open | Prill Brandon M | $296,000 | |
| Previous Owner | Jud Kyle R | $191,468 | |
| Previous Owner | Finley Thad R | $117,800 |
Source: Public Records
Tax History Compared to Growth
Tax History
| Year | Tax Paid | Tax Assessment Tax Assessment Total Assessment is a certain percentage of the fair market value that is determined by local assessors to be the total taxable value of land and additions on the property. | Land | Improvement |
|---|---|---|---|---|
| 2025 | $7,796 | $472,210 | $109,172 | $363,038 |
| 2024 | $8,992 | $465,850 | $0 | $0 |
| 2023 | $6,889 | $423,500 | $109,172 | $320,828 |
| 2022 | $8,173 | $385,000 | $96,328 | $360,535 |
| 2021 | $7,781 | $350,000 | $64,219 | $285,781 |
| 2020 | $7,726 | $338,000 | $64,219 | $273,781 |
| 2019 | $8,065 | $338,000 | $64,219 | $273,781 |
| 2018 | $7,609 | $315,000 | $64,219 | $250,781 |
| 2017 | $6,060 | $245,151 | $64,219 | $180,932 |
| 2016 | $5,922 | $224,309 | $64,219 | $160,090 |
| 2015 | $4,658 | $211,426 | $64,219 | $147,207 |
| 2013 | -- | $189,611 | $65,914 | $123,697 |
Source: Public Records
Map
Nearby Homes
- 2012 Hollyhill Ln
- 2226 Savannah Trail
- 2216 Jefferson Trail
- 2120 Fairfax Rd
- 1000 Lynhurst Ln
- 2100 Fairfax Rd
- 924 Ridgecrest Cir
- 829 Skylark Dr
- 821 Sandpiper Dr
- 2218 Southridge Dr
- 824 Sandpiper Dr
- 916 Smokerise Cir
- 816 Chapel Dr
- 412 Hollyhill Ln Unit 412
- 408 Hollyhill Ln
- 209 Pennsylvania Dr
- 1012 Indian Ridge Dr
- 2253 Hollyhill Ln
- 2272 Hollyhill Ln
- 720 Smokerise Cir
- 2140 Woodbrook St
- 1013 Longridge Dr
- 2145 Pembrooke Place
- 2149 Pembrooke Place
- 2145 Woodbrook St
- 2141 Pembrooke Place
- 2141 Woodbrook St
- 2136 Woodbrook St
- 2153 Pembrooke Place
- 2137 Woodbrook St
- 2137 Pembrooke Place
- 1012 Longridge Dr
- 2201 Woodbrook St
- 2132 Woodbrook St
- 2148 Pembrooke Place
- 2024 Hollyhill Ln
- 2144 Pembrooke Place
- 2133 Woodbrook St
- 2152 Pembrooke Place
- 2020 Hollyhill Ln